
Introduction on How to Find Missing Values in Dataset
Missing values can really spoil all the great work you have done to set up your data analysis to derive insights leading to meaningful changes. That is why we want to show you how to find missing values in dataset!
Missing values are the gremlins of data analysis, where they hide from clear view. The cause of their non-existence is the failure to record them or their absence from datasets when expecting their values. Human errors can cause missing values whenever there are data entry errors with operators failing to enter the necessary values. Another source of missing values is with surveys, where people fail to collect all the relevant data to produce accurate results. The automation side is not that much better either, due to sensors failing and not collecting all the necessary data. Another cause of failure is when data is collected from multiple sources, and it is necessary to merge that data. In many cases, merging can cause data mismatching, resulting in the loss of data point values.
Failure to address these missing values can make conclusions and insights misleading, resulting in undesired outcomes. Trained ML models can exhibit biases leading to biased inferences. Also, inaccurate data will impede their performance. Applying data analytics will result in incorrect conclusions.
1. Understanding Missing Values
In order to show you how to find missing values in dataset we must consider the cause of missing values. However, we need to classify the different types of missing data that are abbreviated as MCAR, MAR, and MNAR. These relate the pattern of missing data to the missing values themselves and the degree to which they are random.
- MCAR (Missing Completely at Random) – the pattern of missing data has no relation to either observed or unobserved data
- MAR (Missing at Random) – the missing data pattern is related to the observed data but not to the missing value itself
- MNAR (Missing Not at Random) – the missing data pattern is related to the value that is missing or unobserved
As mentioned previously, the common causes of missing data include data entry errors, system limitations, and merging issues.
It is imperative to understand how to find missing data in dataset. Otherwise, missing data can cause serious consequences whenever we apply the resulting analytics to critical applications. These include death, serious injury, or severe financial loss when applied to healthcare, safety, or financial applications. Other activities that missing data can impact are marketing, regulatory compliance, manufacturing, transportation, and logistics. These potentially have economic, legal, and reputational ramifications.
2. Why It’s Critical to Detect Missing Values Early
Missing values adversely impact machine learning models and statistical analysis. Missing values make statistical analysis less reliable, and we need to know how to find missing values in dataset. They also negatively affect machine learning models, where they perform poorly on new and unseen data. Additionally, they also disrupt feature relationships by undermining the patterns that ML models use.
Furthermore, missing values can disrupt key insights, resulting in misleading interpretations of trends and patterns. They can also underrepresent or overrepresent certain underlying patterns and introduce bias into statistical patterns and ML models. Financial ramifications are especially serious when driving poor business decisions, resulting in either financial losses or missed opportunities.
Automated detection techniques are an important consideration on how to find missing values in dataset. Most statistical analysis and ML models use large data volumes, making manual methods impossible. Therefore, we need automated detection methods coupled with manual oversight.
3. How to Find Missing Values in Dataset Using Python
The Python Pandas library provides data structures for working with structured (tabular) data. It is widely used for data preprocessing and cleaning and provides useful functions for finding missing values. It is also popular for data exploration and analysis. However, here we will consider its use on how to find missing values in dataset.
The two key data structures that it provides are the DataFrame and Series. Data processing uses DataFrame for working with tabular data, most structured datasets are organized as tabular data. The application for Series data structure is for single columns or one-dimensional arrays.
Once data is loaded into either of these structures, we can apply the following functions to find missing values.
- isnull(), isna(), info(), describe()
- df[df.isnull().any(axis=1)]
3.1 Search Functions to Find Missing Values in Dataset
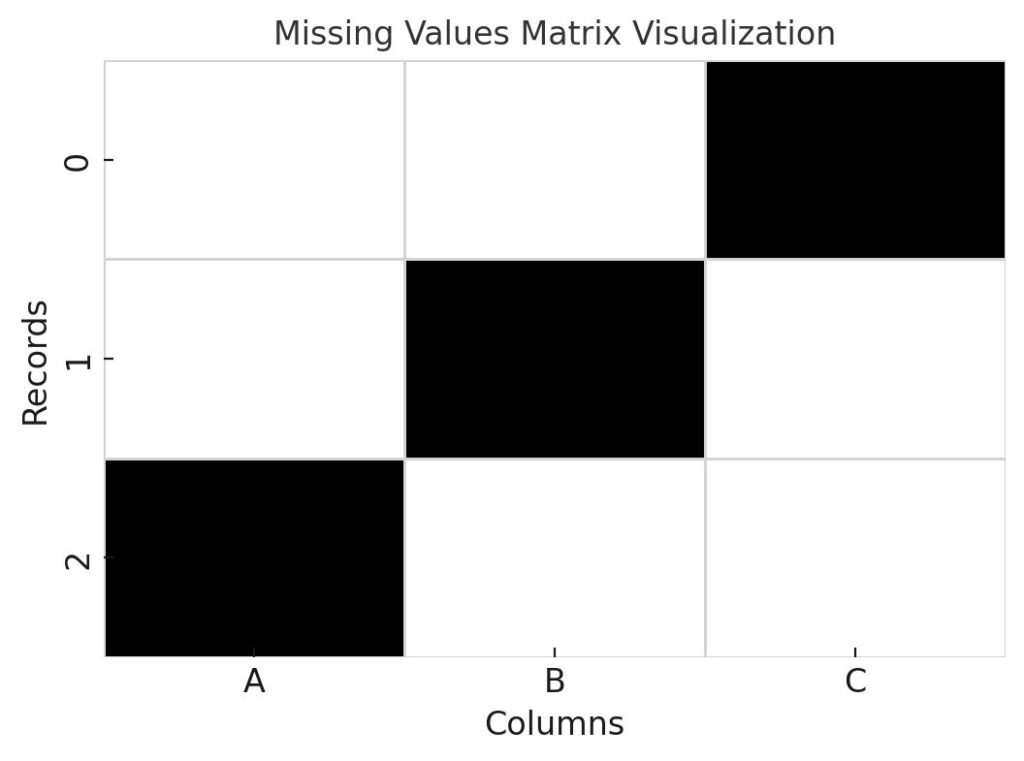
The isnull() function can be applied to either the whole data structure or individual cells. When applied to the entire structure, it provides a table showing where data is present and where it is missing, as shown in the example below.
import pandas as pd

df = pd.DataFrame({
    'A': [1, 2, None],
    'B': [4, None, 6]
})

# Apply isnull to the whole DataFrame
print(df.isnull())
The output is:
       A      B
0  False  False
1  False   True
2   True  False
This is an automated way to find missing values in structured datasets.
The isna() function is a shorthand alias for isnull() and behaves exactly the same way.
3.2 Summary Functions to Understand Data Structure
While isnull() provides a detailed view of each cell, info() summarizes the overall structure of the dataset. When applied to a DataFrame, it provides a summary of all columns; when applied to a Series, it summarizes the single column. Common summaries include:
- Non-null count
- Dtype (data type)
- Memory usage
In contrast, describe() generates useful statistics about the data, which can help identify unusual patterns or missing values for further investigation. Common statistics include:
- Mean
- Count
- Standard deviation
3.3 Visualizing Missing Values with Python Libraries
Automated techniques are essential for detecting missing values, but they alone are not enough. Manual oversight is still important to fully understand data quality. The following libraries allow us to visualize missing data patterns for important insights:
- Missingno library
- Seaborn heatmaps
Missingno provides simple and intuitive visualizations, helping users quickly identify missing data patterns across a dataset.
Seaborn heatmaps display missing data patterns by using a color-coded matrix, making it easy to spot gaps and anomalies visually.
4. Profiling Tools to Find Missing Values in Dataset
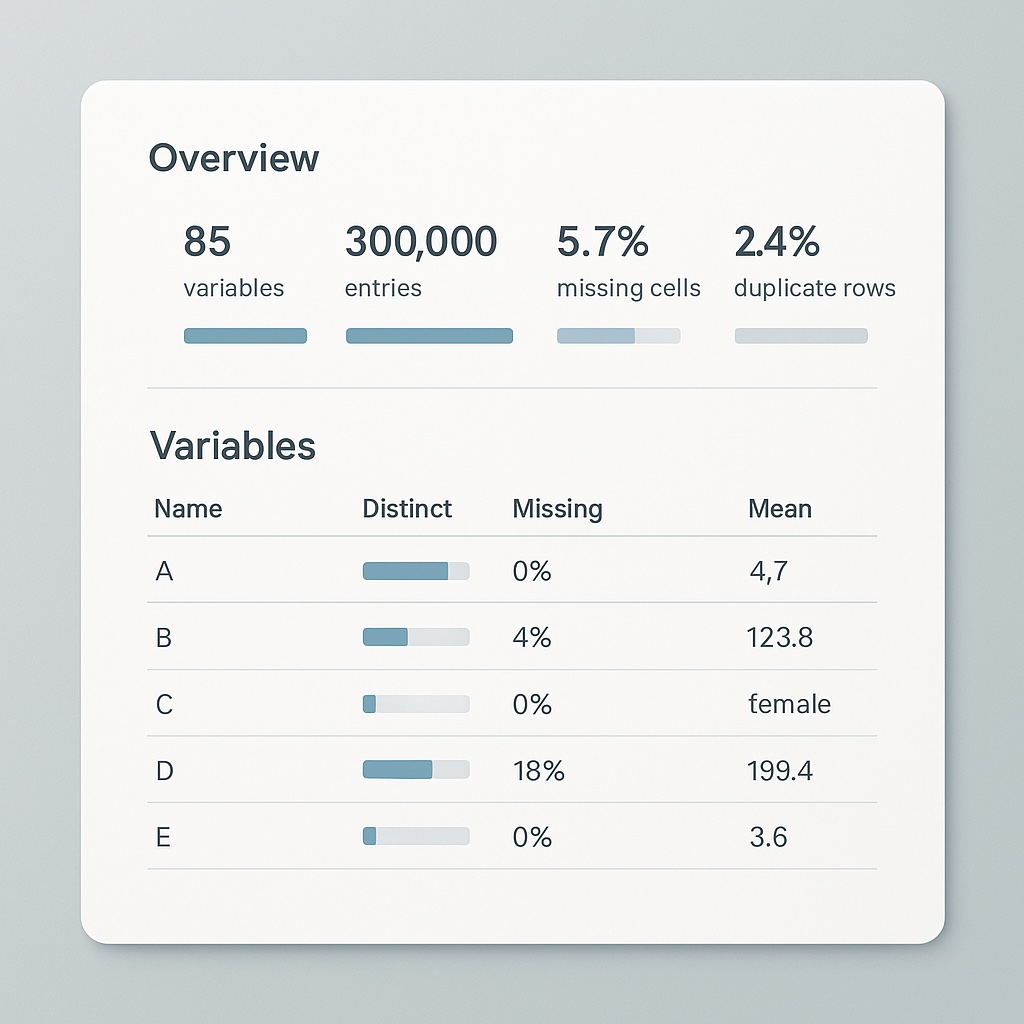
We have already covered the Python Pandas library on how to find missing values in dataset. This provides detailed reports on missing values along with duplicates, and data types. It also provides detailed statistics, including the mean, median, and standard deviation for each column. Subsequently, we can use it to quickly identify patterns, anomalies, and data quality issues without manual inspection. Another important feature set is visualizations, including histograms, correlation matrices, and missing data heatmaps.
Sweetviz is an alternative Python library used to find missing values in datasets. It generates high-visual, automated exploratory data analysis (EDA) reports. For ML model training, it provides detailed comparisons between training and testing datasets. These comparisons highlight missing values and also feature distributions and correlations. It also assists with manual inspection through intuitive graphs that simplify and speed up spotting data issues.
We need automated tools for inspecting large datasets where manual inspection is not only impractical but impossible. However, we also need to identify patterns, clusters, and anomalies in missing data. Therefore, in addition to automated tools, we also need visual tools. Whenever our visual tools flag unusual findings, we need to investigate these findings through manual inspection. Manual inspection is also needed whenever we need to verify specific records.
5. Strategies for Auditing Missing Data in Large Datasets
Data quality resembles product quality management in manufacturing and can borrow from their techniques. In manufacturing, it is impossible to check every product for quality; therefore, sampling and batch inspection were introduced. This led to control charts, allowing the identification of any processes that introduced anomalies.
These ideas are transferable to auditing large datasets and form part of our arsenal on how to find missing values in dataset. Without needing to scan the entire dataset, we can review a small data subset to check for data quality issues, including missing data. This follows from the sampling theorem, where we can derive the behavior of the entire population from samples. This also allows batch inspection, where we can perform systematic review and anomaly detection.
It is important not only to find missing values but also to identify and rectify their underlying causes. Logs that capture events like data entry failures or system errors can help explain why there are missing values. We can also derive missing data patterns from metadata that provides details around data sources, formats, and timestamps.
In addition to the Python libraries above, AWS Glue DataBrew offers automated profiling to detect missing values at scale. Within machine learning, Amazon Sagemaker Clarify helps to identify missing data issues as part of machine learning data bias analysis. Integrating these services with data pipelines will streamline missing data detection across large, distributed datasets.
For a deeper look at how to prepare and preprocess datasets in AWS before analysis, check out our guide on AWS ML Data Preprocessing.
6. Best Practices for Documentation and Reporting
A crucial activity that forms part of how to find missing data in dataset is proper documentation and reporting. The outcomes from our Python tools and AWS services contribute to maintaining a data quality report. This should contain key descriptive statistics around datasets and their quality issues, along with known data issues. Other items should include the data types for each column, along with a summary of outliers. They should also include actions or recommendations for remediation.
Preprocessing steps are crucial for setting the foundation of high-quality datasets, and you can learn more about them in our guide on AWS ML Data Preprocessing.
These reports are essential when collaborating with upstream data producers when remediating data quality issues. Producing a report that distills all the information around data quality that is actionable will enable the timely resolution. Often, data producers are external parties, making clear communication even more vital.
It is useful to accompany these reports with data dictionaries for added clarity when documenting data quality issues. These describe the fields (columns) in a dataset that the reader can refer to when trying to comprehend the report’s contents.
Conclusion on How to Find Missing Values in Dataset
Missing values in datasets are not detrimental to statistical analysis and ML models, but can result in very serious consequences. These can include severe financial loss, legal and criminal proceedings, and profound reputational damage.
How to find missing values in dataset consists primarily of automated tools with manual oversight. Python libraries Pandas and Sweetviz provide detailed analysis, along with summary statistics and visualization tools. This allows automated missing value detection, while summary statistics and visualization allow for manual oversight. It is crucial to combine these tools with sampling techniques to infer sample behaviour across the whole dataset population effectively.
AWS Glue DataBrew and Amazon SageMaker Clarify allow integration of data quality management into data pipelines.
Given the serious consequences of missing data values and the available tools, it is imperative to conduct regular data audits. Equally vital is to automate these audits as part of your analytics and inferential workflows.
Further Reading
If you want to explore more on handling missing data, data quality management, and building strong datasets for analysis and machine learning, here are some highly recommended books:
Recommended Books
- Data Preparation for Data Mining by Dorian Pyle
- Bad Data Handbook: Cleaning Up The Data So You Can Get Back To Work by Q. Ethan McCallum
- Practical Statistics for Data Scientists by Peter Bruce and Andrew Bruce, and Peter Gedeck
- Statistical Analysis with Missing Data by Roderick J. A. Little and Donald B. Rubin
Affiliate Disclaimer
As an Amazon Associate, we earn from qualifying purchases. This helps support our blog and allows us to continue providing valuable content. Thank you for your support!
References
- AWS Documentation. (n.d.). AWS Glue DataBrew Developer Guide. Retrieved from https://docs.aws.amazon.com/databrew/latest/dg/what-is.html
- AWS Documentation. (n.d.). Amazon SageMaker Clarify Developer Guide. Retrieved from https://docs.aws.amazon.com/sagemaker/latest/dg/clarify-processing-job.html