1. Introduction to Exploratory Data Analysis in Python
Exploratory data analysis (EDA) in Python highlights why data scientists and machine learning engineers need data to talk to them. It is already clearly understood that poor data will lead to poor decision-making or worse. However, even with good data, incompatible analytics or machine learning models can lead to decision-making resulting in disastrous consequences.
Therefore, we need to derive more profound insights into our data prior to handing it off to our analytics or machine learning algorithms. EDA helps us to uncover patterns, trends, and relationships within our raw data. For machine learning algorithms, it provides guidance around feature selection and modeling decisions by highlighting key variables. It also identifies data quality issues, such as missing values and outliers, that can lead to poor decision-making. EDA also enables intuitive understanding through the visual insights that it provides.
These Python libraries form the foundation of exploratory data analysis in Python workflows:
- Pandas – The Pandas library provides powerful tools for loading, cleaning, and summarizing structured data
- Matplotlib – Enables basic plotting and visualization to explore data distributions and trends
- Seaborn – Seaborn builds on the matplotlib library to easily create aesthetically pleasing, high-level statistical plots. For a deeper dive into creating impactful plots, see our guide to data visualization in Python.
This article will define Exploratory Data Analysis in more detail and explain why Python is incredibly useful for this activity. It will then outline a step-by-step Python workflow for this, along with a helpful case study with the Titanic dataset. Finally, it will consider traps and pitfalls when performing Exploratory Data Analysis.
2. What Is Exploratory Data Analysis (EDA) in Python?
Definition
Exploratory data analysis with Python is the set of activities that analyze datasets to provide summaries of their characteristics. Its most valuable contribution is that data scientists and engineers can build an intuitive understanding of data structure and quality. This allows them to provide the essential human oversight of any machine learning workflows. The key part to building this intuitive understanding is data visualizations that reveal whether assumptions for modelling hold. Further insights are derived when it helps to uncover relationships, patterns, and anomalies that may influence modeling.
Another crucial benefit is that it supports early detection of missing values, inconsistencies, and outliers that threaten to distort any modelling. This can produce misleading outcomes with potentially severe consequences.
Overall, Exploratory Data Analysis in Python lays the foundation for informed preprocessing, feature engineering, and model selection.
Difference from Descriptive Statistics and Data Cleaning
Although descriptive statistics are available to data scientists and engineers, they provide measures like the mean, median, and standard deviation. However, it only summarizes data while EDA interprets and visualizes it to uncover deeper insights. This is because it goes beyond numbers and explores patterns, relationships, and potential modeling issues. More importantly, descriptive statistics are a static summary while EDA is an iterative process, evolving with each new discovery.
Data cleaning is vital for any machine modeling workflow. However, Exploratory Data Analysis in Python helps to decide what cleaning is needed. We can better optimize our data cleaning stages within our overall workflow.
Real-World Use Cases of Exploratory Data Analysis in Python
It is useful to consider several real-world use cases where data scientists use Exploratory Data Analysis in Python. In finance, EDA can reveal unusual patterns or outliers that may indicate fraudulent activity. Also, when analysts visualize transaction data, EDA can help them detect anomalies that deviate from normal behavior.
Sales and marketing can use EDA to help identify trends and preferences in customer purchase patterns. Marketers can also discover segment-specific behaviors that can guide personalized marketing and product decisions.
3. Why Python for Exploratory Data Analysis (EDA)?
We have been looking at Exploratory Data Analysis and its role in analytics and machine learning. Now we will consider why Python is such a valuable tool for performing Exploratory Data Analysis. It offers greater flexibility and integration with machine learning workflows than other tools, such as R.
It also has powerful libraries that simplify data manipulation and visualization, making it ideal for Exploratory Data Analysis. We have already briefly summarized some of these libraries, but will consider them more in-depth.
Pandas
This is a powerful library enabling us to easily load and inspect structured datasets using only a few lines of code. It provides efficient functions for cleaning, transforming, and summarizing data for further analysis.
Matplotlib
Visualization is a fundamental activity in exploratory data analysis. Matplotlib allows us to create line plots, histograms, and bar charts that reveal trends and distributions. These customizable and easy-to-generate plots help to reveal trends and distributions.
Seaborn
Building on Matplotlib, Seaborn improves chart aesthetics and simplifies statistical visualizations. It also provides built-in support for statistical plots, including boxplots, heatmaps, and violin plots.
Plotly
Where Seaborn focuses on clean statistical charts, Plotly adds interactivity and support for advanced visuals like 3D plots and time series. Users are able to zoom, hover, and explore data dynamically. It also supports complex charts, such as 3D plots and time series, while providing a user-friendly interface.
Missingno
Searching for missing patterns in datasets is a core exploratory data analysis activity. Missingno provides quick visualizations that allow us to identify missing data patterns in a dataset. These visualizations include heatmaps, bar charts, and matrix plots that help detect data gaps.
4. Step-by-Step Exploratory Data Analysis Workflow in Python
We have reviewed the main libraries around Exploratory Data Analysis in Python. Now, we will consider how to use Python libraries and functions for each of the different EDA activities.
a. Loading and Inspecting Data
The Pandas library provides functionality to load and inspect data for further exploration. Correspondingly, the principal data type for this library is the DataFrame class. Therefore, all the Pandas methods are either around populating objects of the DataFrame class or manipulating it in some way. These are either creating, inspecting, transforming, or analyzing a DataFrame object. Below are the most commonly used and widely recognized Pandas methods.
read_csv
Allows populating a DataFrame object from a comma-separated value (csv) file.
import pandas as pd
df = pd.read_csv('data.csv')
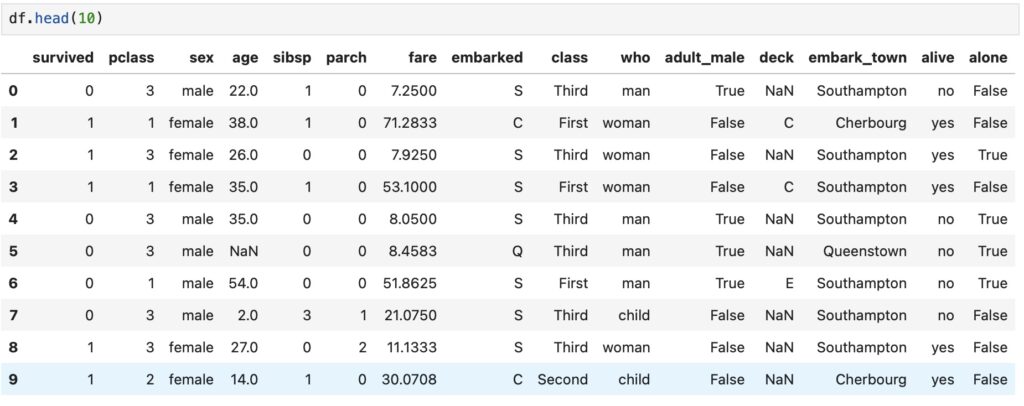
head
This outputs the first few rows of the DataFrame object to allow a quick glance at the data.
df.head()
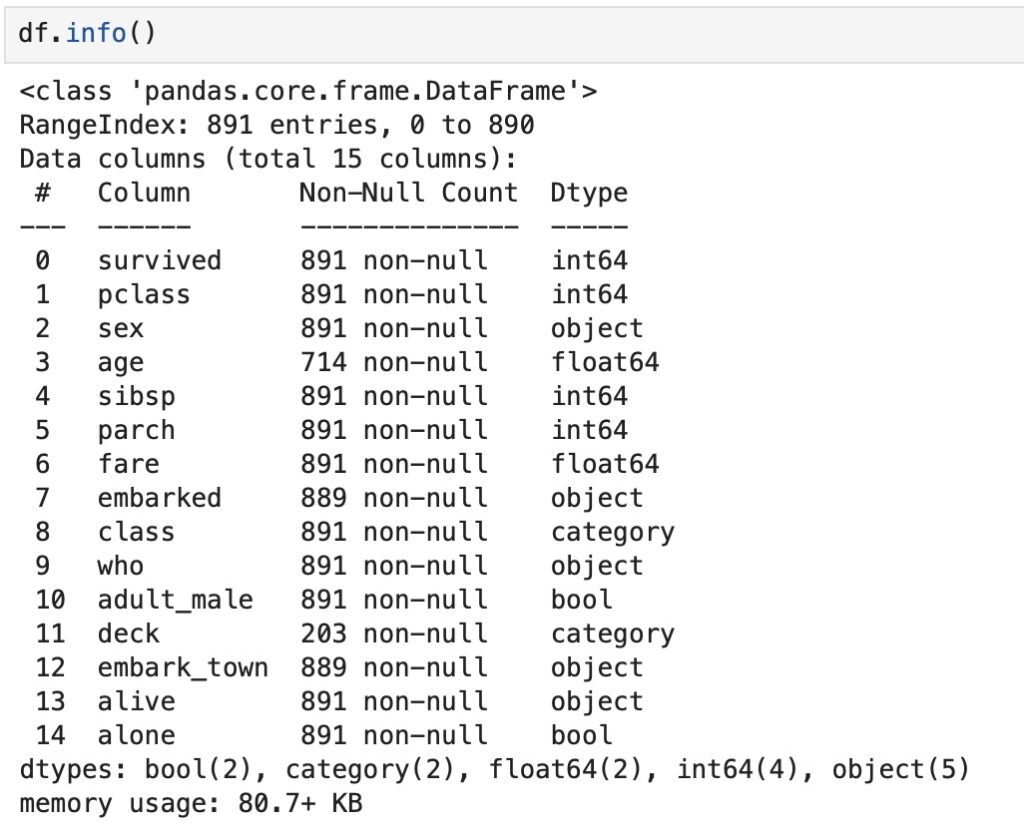
info
This provides a summary of the column types, non-null counts, and memory usage.
df.info()
describe
This function generates summary statistics for each of the numeric columns, including mean and standard deviation.
df.describe()
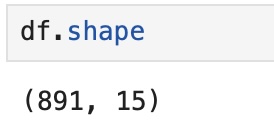
shape
This provides the number of rows and columns in the dataset.
df.shape
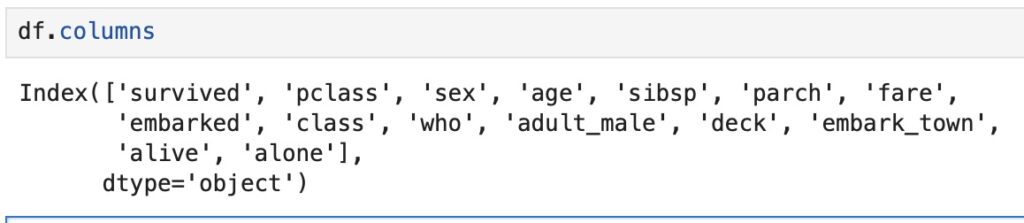
columns
This provides the column names that help to understand the structure of the DataFrame object.
df.columns
dtypes
This function details the data types for each column. This is essential for spotting type mismatches.
df.dtypes
sample
Allows us to inspect a few random rows that can uncover unexpected values or formatting issues.
df.sample(5)
b. Handling Missing Data
Missing data is a significant class of problems for machine learning, since many data sources have varying degrees of reliability. Consequently, we can end up training machine learning models on incomplete data that is as harmful as misleading data. This results in decisions ranging from poor to catastrophic, depending on the application. Therefore, handling missing data is a substantial activity for Exploratory Data Analysis in Python.
Besides data inspection, the Pandas library also supports functions that handle missing data on both the DataFrame and Series classes. These functions are explored in detail below.
isnull
The isnull() function identifies missing values in a DataFrame or Series object by returning a Boolean mask. It is commonly used to detect NaN entries so that we can perform further cleaning or analysis.
df.isnull()
dropna
When we want to remove rows or columns containing missing values from a DataFrame or Series, we use the dropna method. We can clean the dataset by eliminating incomplete data based on a specific axis.
df.dropna()
fillna
On the other hand, if we want to replace missing values with a specified value or method, then we use the fillna method. Here, we can maintain dataset completeness without dropping rows or columns.
df.fillna(0)
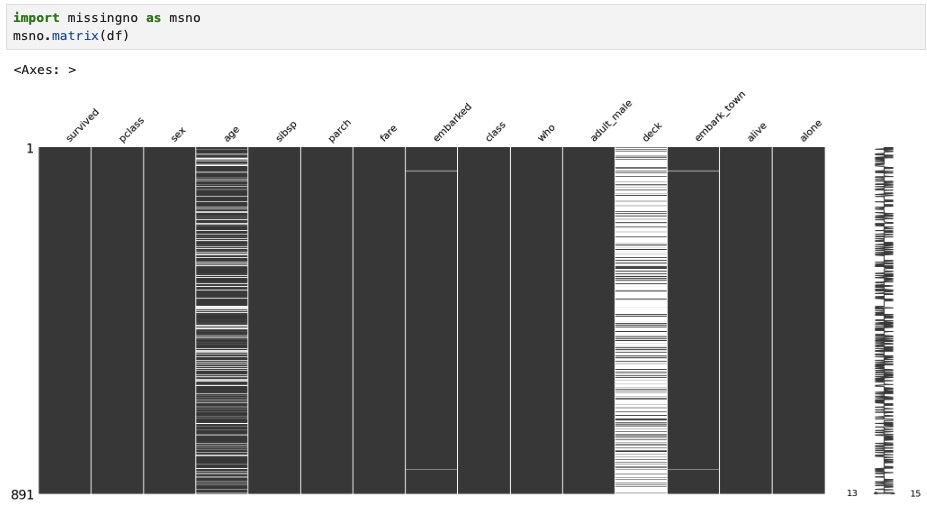
missingno.matrix
This allows us to create a visual summary of missing data patterns across the dataset. It helps us to quickly identify gaps, null clusters, and completeness at a glance.
import missingno as msno
msno.matrix(df)
c. Univariate Analysis
Superficial inspection of data is highly useful but insufficient for Exploratory Data Analysis in Python. We often want to delve deeper into the data and discover more important insights. These include the distribution, central tendency, and spread of each individual variable.
This helps us to answer questions that data manipulation or missing value detection will not tell us. Often, data is skewed or may contain outliers that can distort machine learning models’ representation of the data source. The shape of the distribution is often crucial, and different distributions are suited to various learning models. Another important consideration is the variable type on whether variables are categorical, uniform, or continuous. Again, different learning models and data preprocessing are needed for different types.
Two useful plots for visualizing individual features are histograms and boxplots supported by the matplotlib and seaborn libraries.
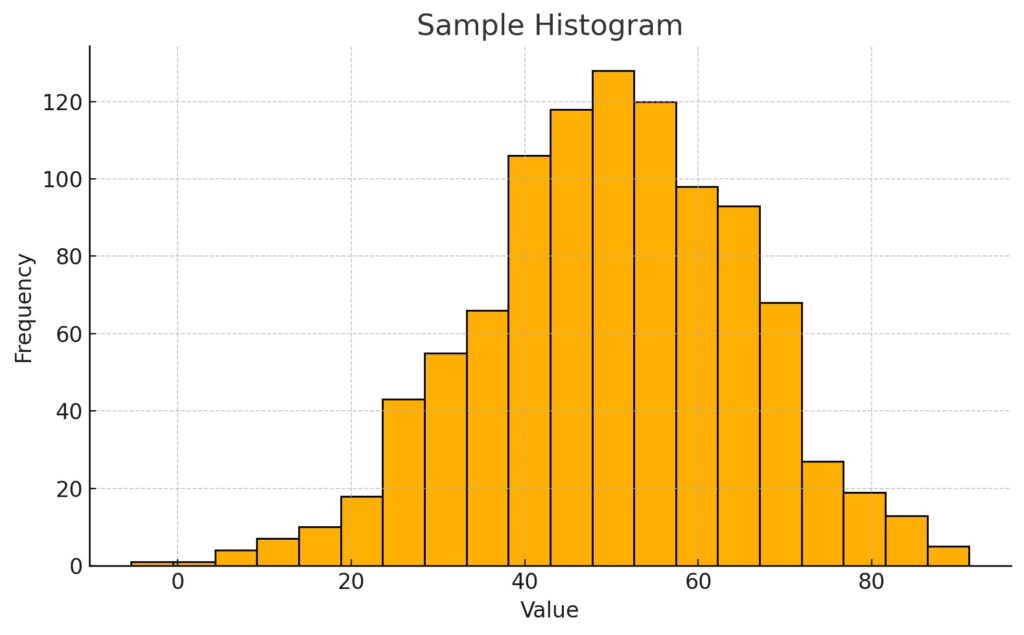
Histograms
These visualizations display the distribution of a numerical variable by grouping data into bins. They help to reveal patterns such as skewness, modality, and the presence of outliers. Typically, we would use these when we want to discover if there are any unusual patterns in the distribution.
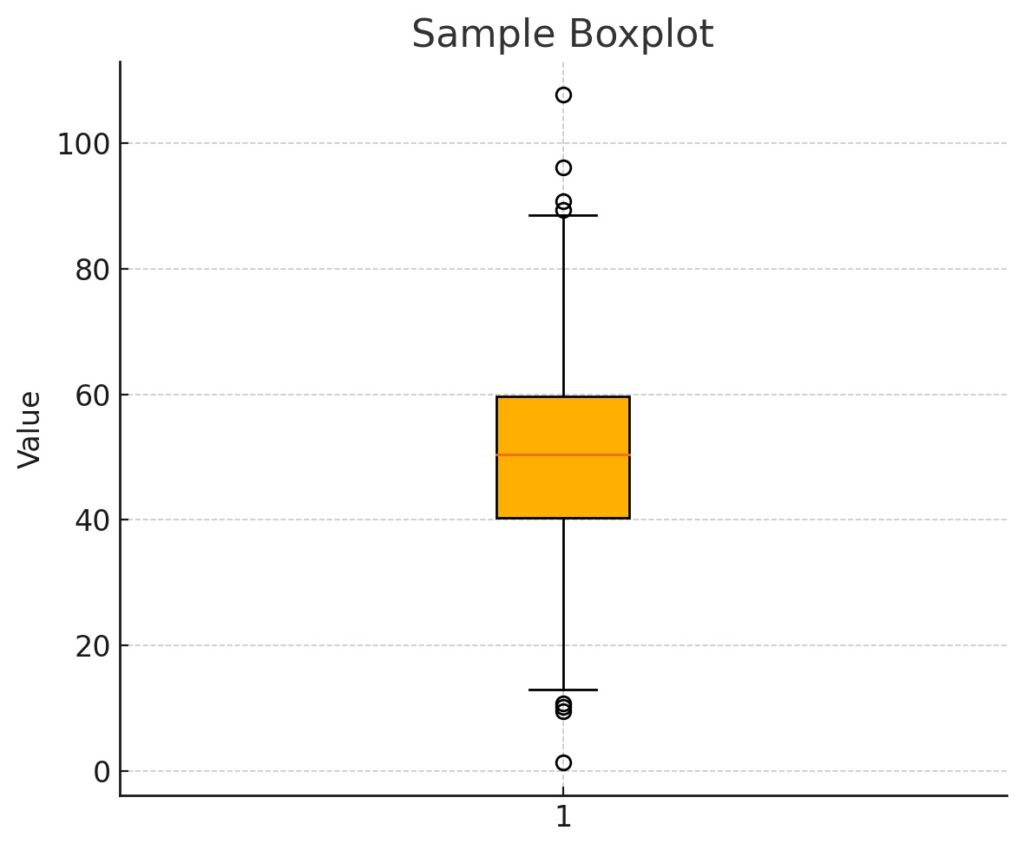
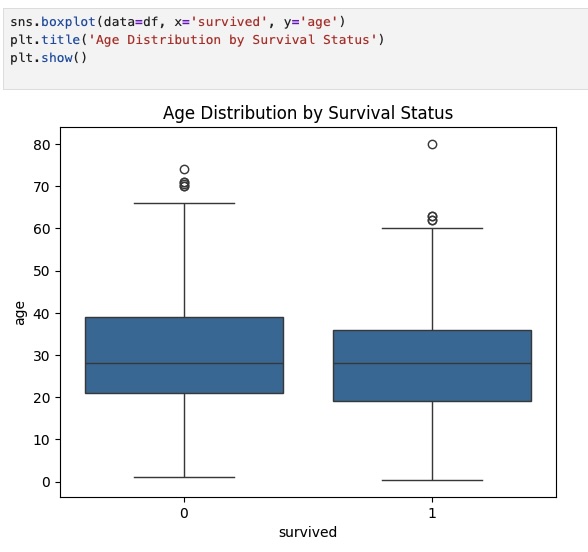
Boxplots
Whereas Histograms focus on frequency distribution and its shape, boxplots focus more on concise summarizing of key statistical properties. These include medians, quartiles, and outliers without showing the detailed distribution shape. We use these when we want to highlight the central tendency, spread, and outliers, and compare these across categories.
d. Bivariate/Multivariate Analysis
Univariate analysis is useful for understanding distributions of individual variables within Exploratory Data Analysis in Python. However, we often need to understand the relationship between two or more variables.
Bivariate analysis examines the relationship between two variables to determine whether there is causality or correlation. An example is when we want to compare income and education level.
Multivariate analysis is used when we want to uncover patterns across multiple variables or prepare for modeling. An example is when a hospital wants to determine when to discharge a patient based on many variables. Multivariate analysis is most useful here to identify which variables are most strongly associated with readmission and build a predictive model for this.
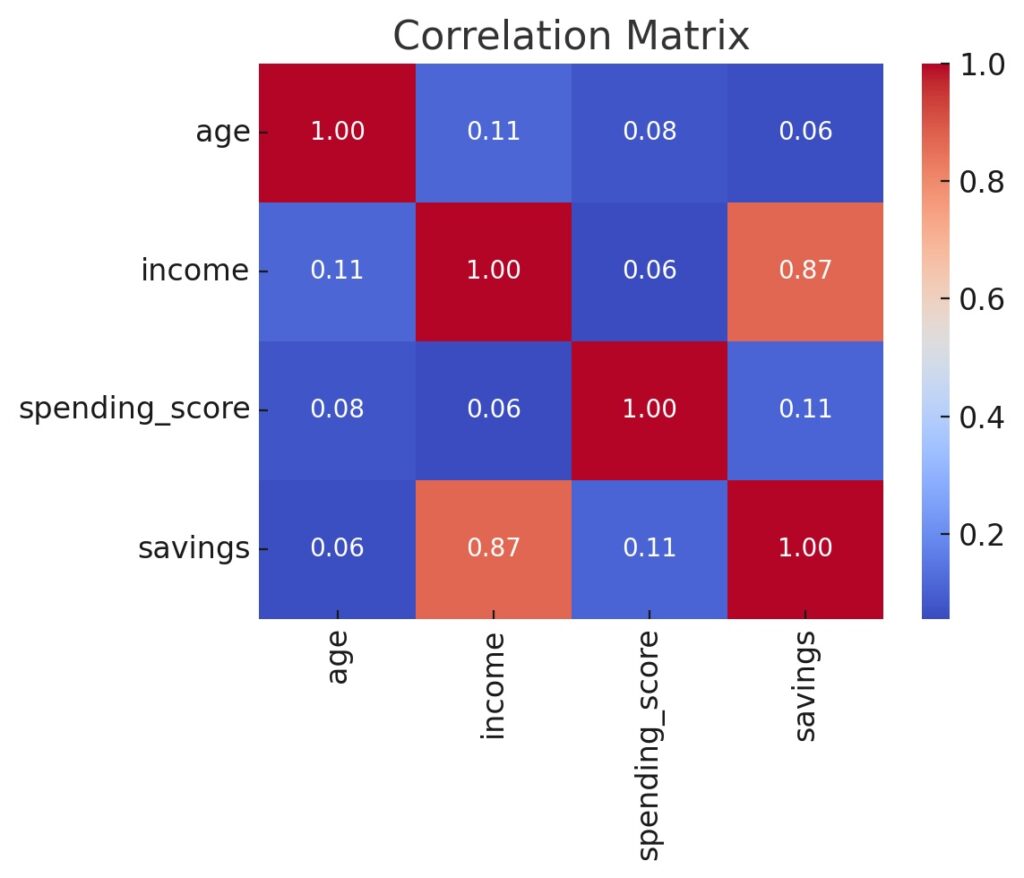
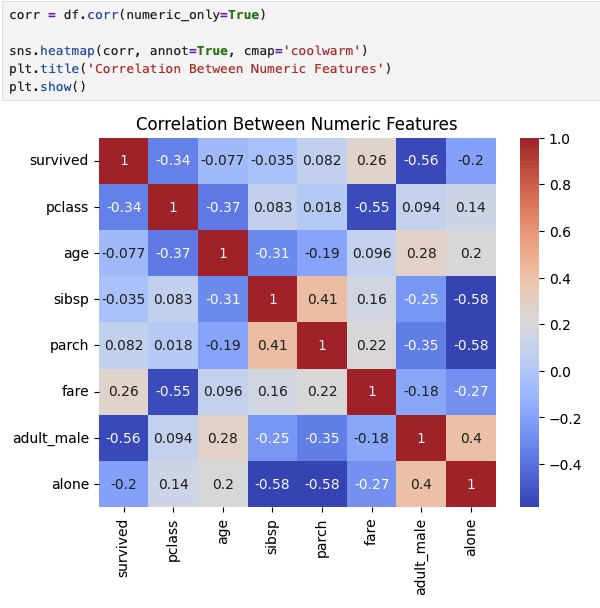
Correlation Matrix
This is applicable for both bivariate and multivariate visualizations and shows pairwise correlations between all numeric variables. Multivariate summaries are composed of bivariate relationships. This is supported by the Pandas library, in combination with either the Matplotlib or Seaborn libraries.
correlation_matrix = df.corr()
import seaborn as sns
sns.heatmap(correlation_matrix, annot=True)
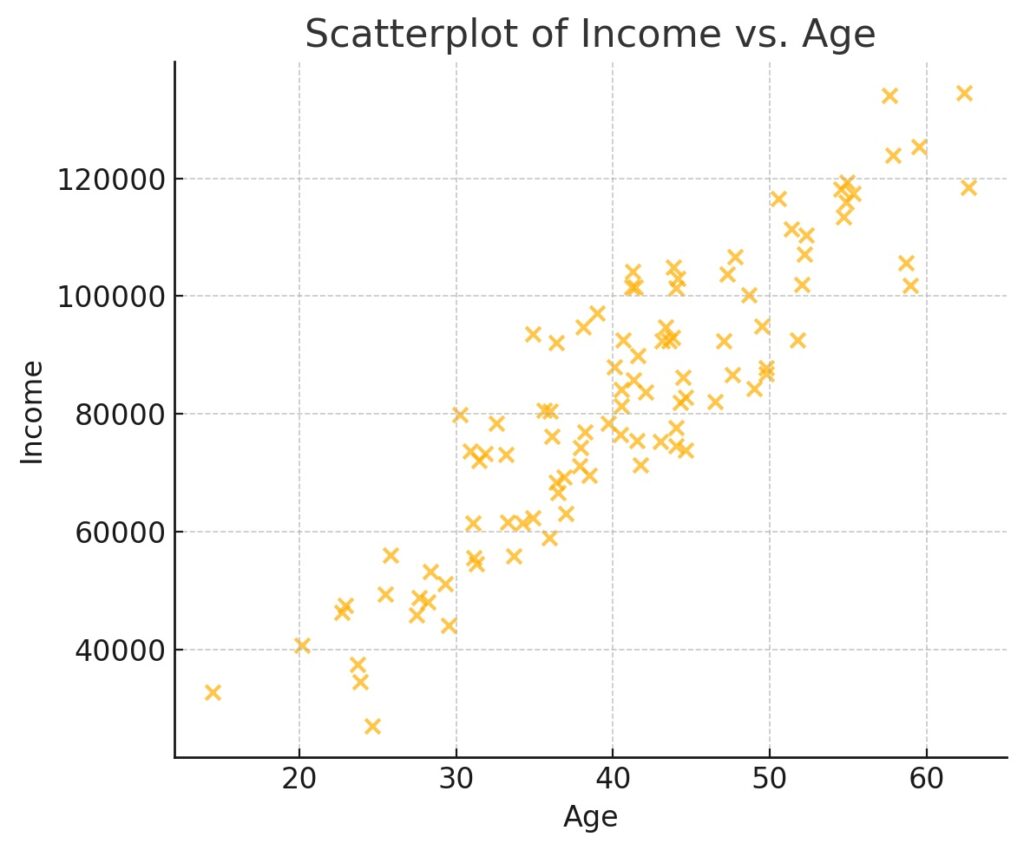
Scatterplots
Scatterplots are only applicable for bivariate analysis and are useful for identifying linear relationships or clusters. This is supported by the Matplotlib, Seaborn, and Plotly libraries.
import matplotlib.pyplot as plt
plt.scatter(df['age'], df['income'])

import seaborn as sns
sns.scatterplot(x=df['age'], y=df['income'])

import plotly.express as px
fig = px.scatter(df, x='age', y='income')
fig.show()
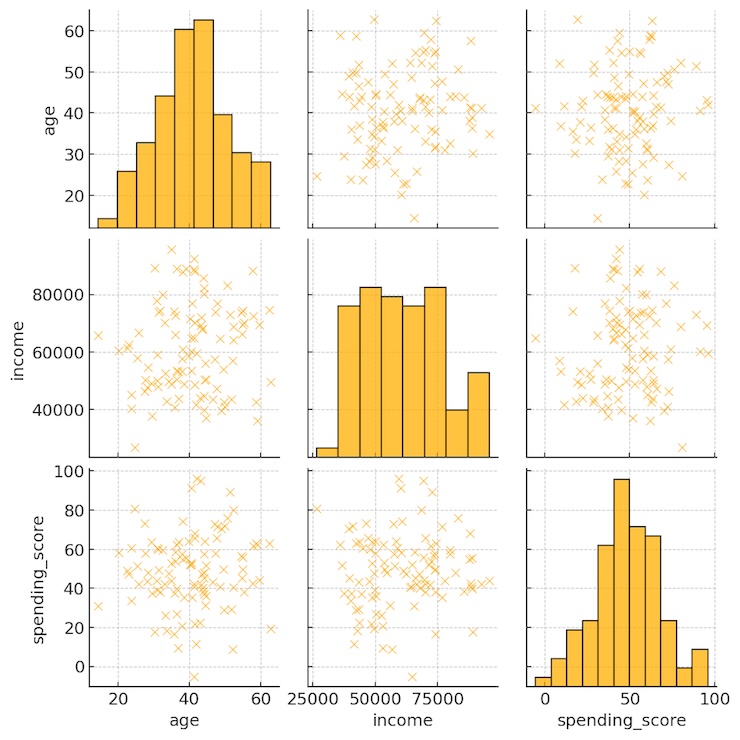
Pairplots
Pairplots generate scatterplots for all combinations of numeric variables with histograms on the diagonal. They are considered multivariate since they provide a compact view of all bivariate combinations. This is only supported by the Seaborn library.
import seaborn as sns
sns.pairplot(df)
5. Case Study: Exploratory Data Analysis in Python on Titanic Dataset
We will now provide a practical example on Exploratory Data Analysis in Python on the Titanic dataset. We selected Titanic since that is a real world example with all the issues associated with uncurrated datasets. To demonstrate this we used a MacBook Pro with the M4 Pro Max, 48 GB of RAM, and 1 TB SSD.
Setup Exploratory Data Analysis in Python
Ensure Python is already installed, and if not, then install from https://www.python.org/downloads/ (The page will automatically suggest the correct version for your operating system).
Once we have set up a virtual environment, we upgrade our pip and install the following libraries:
- numpy
- pandas
- scikit-learn
- matplotlib
- Seaborn
pip install numpy pandas scikit-learn matplotlib seaborn
Titanic Dataset as an example of Exploratory Data Analysis in Python
This is a classic dataset that contains real passenger data from RMS Titanic that sank on April 15th, 1912. It is generally used for demonstrating exploratory data analysis with Its key features listed below.
| Column | Description |
|---|---|
| PassengerId | Unique identifier for each passenger |
| Survived | Survival (0 = No, 1 = Yes) |
| Pclass | Passenger class (1 = 1st, 2 = 2nd, 3 = 3rd) |
| Name | Full name of the passenger |
| Sex | Gender of the passenger |
| Age | Age in years (some missing values) |
| SibSp | # of siblings/spouses aboard |
| Parch | # of parents/children aboard |
| Ticket | Ticket number |
| Fare | Ticket fare |
| Cabin | Cabin number (many missing values) |
| Embarked | Port of embarkation (C = Cherbourg, Q = Queenstown, S = Southampton) |
Particularly, it is directly available from the Seaborn library.
import seaborn as sns
import pandas as pd

df = sns.load_dataset('titanic')
df.head()
Jupyter Notebook
All code was run on the Jupyter Notebook that was set up with the following commands.
python -m venv .venv
source .venv/bin/activate
jupyter notebook
Data Inspection: Initial Exploratory Data Analysis in Python
We first inspect our dataset using the following commands
df.info() presents the basic structure of our Titanic dataset
In addition, df.head(10) shows the first 10 rows of the Titanic dataset
Furthermore, df.columns lists all the Titanic dataset columns
Moreover, df.shape shows the number of rows and columns
Also, df.dtypes shows the data type for each column
Missing Data Handling
After inspecting the data, we performed the following activities to handle missing data on the Titanic dataset.
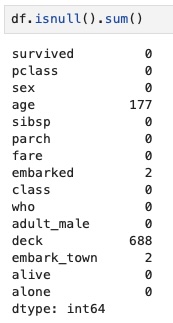
First, we identified the missing data using the isnull() and sum() functions.
Although this summarizes our missing data, we wanted more insight from visualizations where we used the missingon function. Visualizations are especially useful in helping to spot correlations in missing data (e.g., entire rows missing multiple fields). First, we visualized missing Titanic data as a matrix.
Then, as a heatmap.
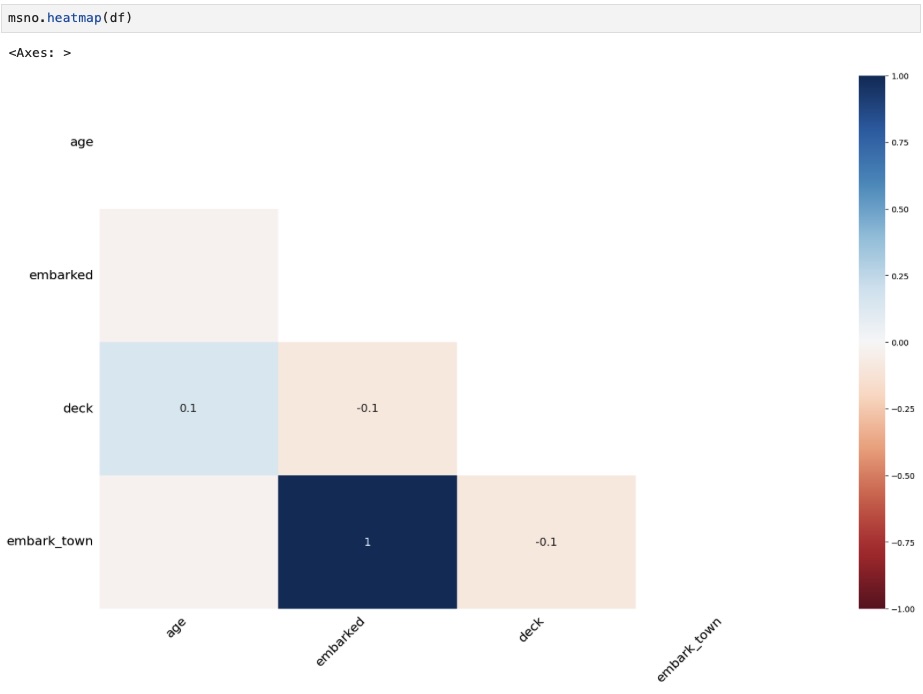
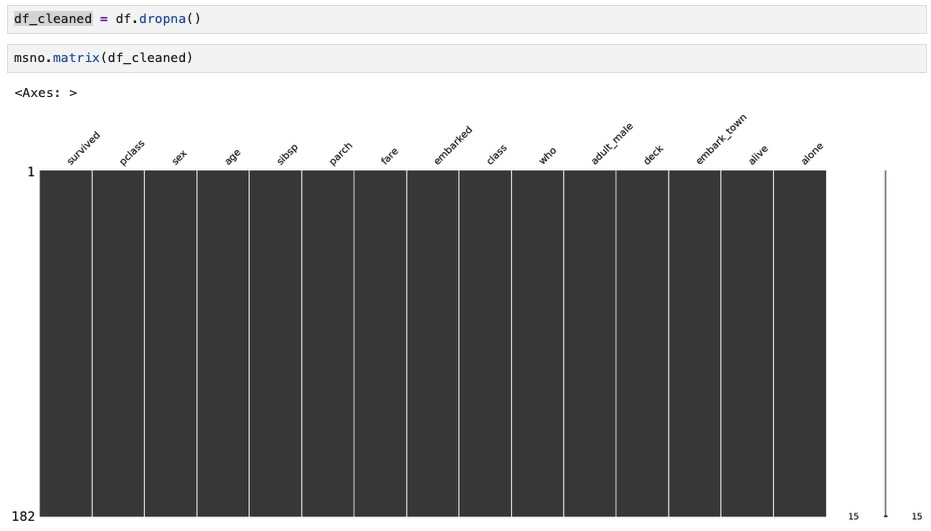
Whenever we see that our missing data is small and random, it is best to quickly drop that data. Therefore, we applied the dropna function to our Titanic dataset. Next, ran the missingon function on the cleaned data to visualize missing data as a matrix. However, it did not show any missing data as we expected.
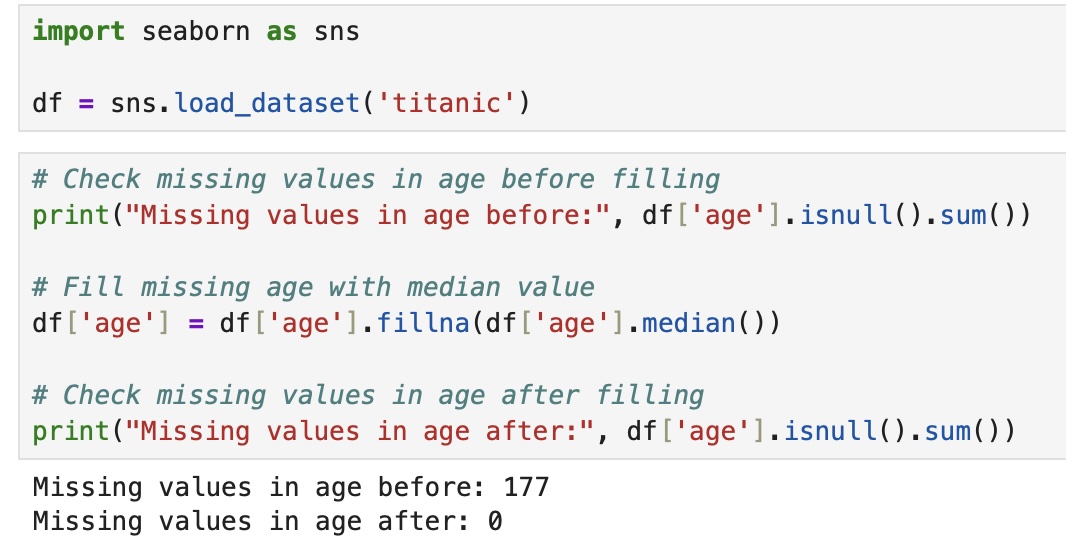
Conversely, when missing data is more frequent and exhibits specific patterns, then dropna is inadequate for modeling our data properly. We should estimate the missing values to reflect the meaning and impact of the column for our dataset. Since age has missing values and is continuous, we can fill in the age with the median.
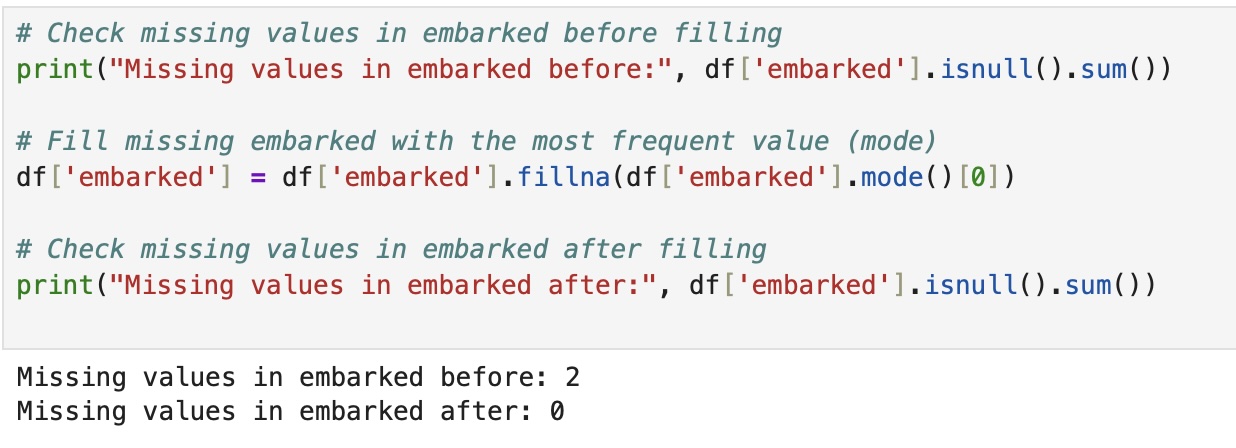
Correspondingly, for discrete values like embarked, we filled it with the most common value.
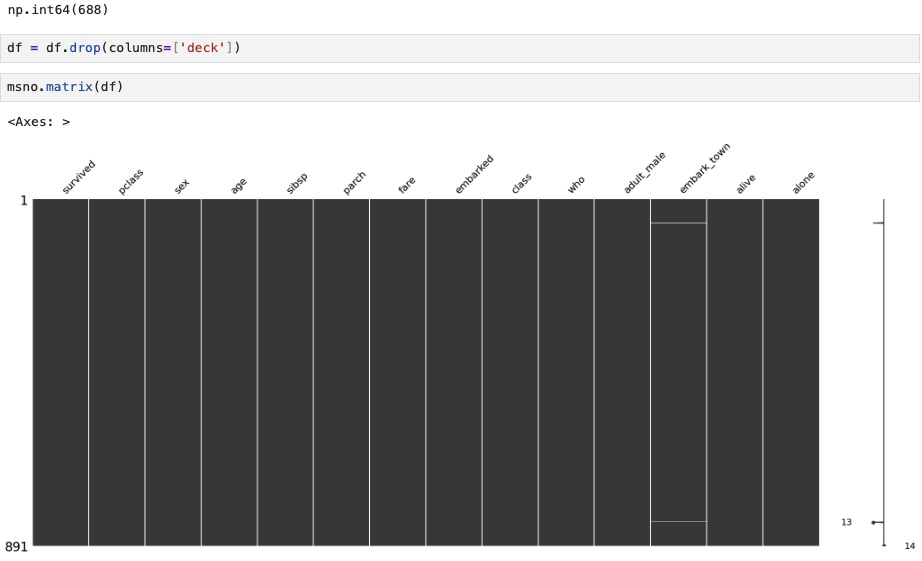
Likewise, whenever columns have too many missing values (70-80%), then we should drop the column. Henceforth, the deck column has 688 missing values out of 891 rows, and we should drop it. We dropped it and redisplayed the missing values matrix with the deck column no longer there.
Univariate Analysis
We now want deep insights into the data, especially around the distribution and whether it distorts the world we are observing.
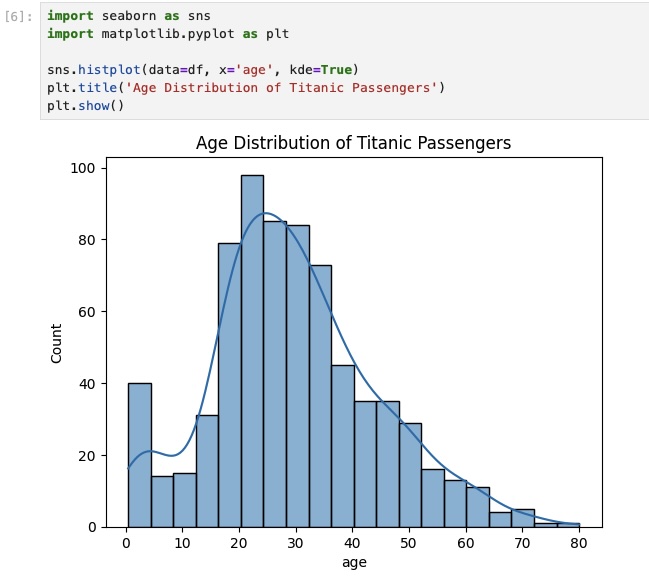
Accordingly, we visualize the distribution of Titanic passenger ages will help identify skewness, missing gaps, and unusual patterns.
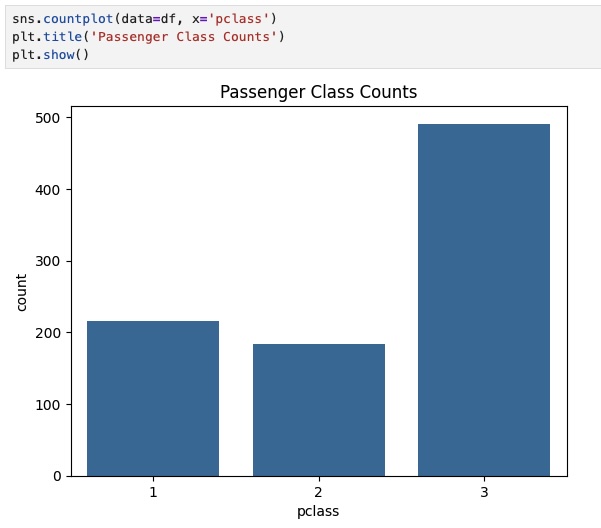
Additionally, we can examine the frequency of each class that the Titanic passengers travelled to examine any class imbalances.
Bivariate Analysis
We also want even deeper insights around how different variables are related to one another, often one categorical and the other numerical.
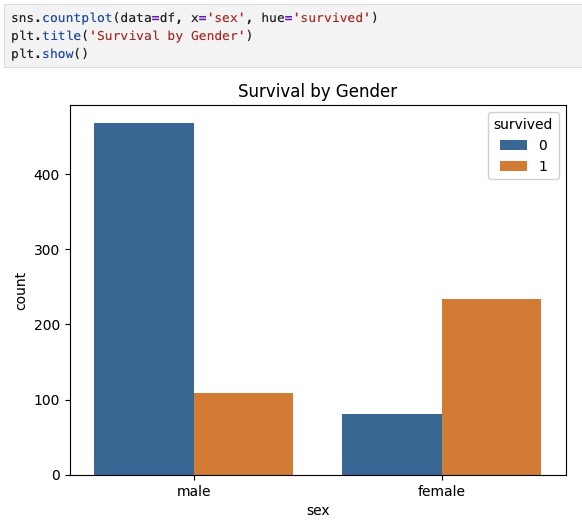
Especially in terms of survival by gender, where we can clearly see that women had higher survival rates.
Another interesting bivariate distribution is survival by age, which illustrates the central tendency and outliers of age within each group. We may also see whether age impacted survival likelihood.
To guide feature selection, we also examine how various features relate to each other and to survival. The heatmap below highlights the correlations between numeric features, showing that fare, age, and pclass have notable relationships with survived.
6. Common Pitfalls and Best Practices
We can certainly see the immense value of Exploratory Data Analysis in Python. However, we need to follow certain best practices to ensure that we do not get a flawed understanding.
Some common mistakes that can distort our understanding include ignoring data types, not visualizing, and overcleaning. Ignoring data types may lead to treating categorical variables as numeric, leading to incorrect analysis. Whenever we skip visualizations, we may miss patterns, trends, and outliers that summary statistics alone cannot reveal. Overlean can lead to removing too much data, which can discard valuable information and introduce bias.
Consequently, it is highly valuable to follow these tips, always visualize, iterate, and annotate findings. Making plots of our data will help to uncover hidden patterns and validate any assumptions we have about our data. It is always essential to understand that EDA is an evolving process, and each iteration reveals new insights. Annotations are vital in guiding modeling decisions and reproducibility, as well as providing an audit trail.
7. Conclusion: Turning Data into Insight
Exploratory Data Analysis in Python enables scientists and engineers to develop an intuitive understanding of their data. This is especially crucial in building analytics and machine learning models to derive accurate insights from the data.
In summary, we covered the following steps: loading, inspection, handling missing data, univariate analysis, bivariate analysis, and frequent visualizations. We load and inspect our data to understand its structure. We also need to handle missing data to maintain the integrity of our data. Additionally, we should perform univariate and bivariate analyses to explore distributions and relationships within our data.
8. Further Reading on Exploratory Data Analysis in Python
Python Data Science Handbook by Jake VanderPlas – A comprehensive guide to Python tools for data analysis and machine learning. Includes detailed EDA techniques using Pandas, Matplotlib, and Seaborn.
Effective Pandas by Matt Harrison – A practical guide to mastering Pandas for data cleaning and EDA tasks. Great for improving DataFrame manipulation fluency.
Storytelling with Data by Cole Nussbaumer Knaflic – While not Python-specific, this book helps analysts craft compelling visual narratives—ideal for EDA interpretation and communication.
Affiliate Disclaimer
As an Amazon Associate, we earn from qualifying purchases. This means that if you click on a book link and make a purchase, we may receive a small commission at no additional cost to you. This helps support the site and allows us to continue creating valuable content for readers like you.
9. References
Seaborn Documentation – Statistical Data Visualization – Official resource for Seaborn, including advanced plotting techniques for EDA. Reference for pairplots, boxplots, heatmaps, and more.
Matplotlib Tutorials – Real Python – A well-structured, beginner-friendly guide to Matplotlib. Excellent for readers new to visualizing data in Python.
Pandas User Guide – The go-to reference for data wrangling, summarization, and inspection methods used in EDA.
Missing Data Visualization with Missingno – Learn how to visualize missing data patterns and use heatmaps, dendrograms, and matrix plots for deeper inspection.
Exploratory Data Analysis in Practice – Towards Data Science – A helpful overview with hands-on code examples for real-world data analysis.
Kaggle Notebooks on Titanic EDA – Browse top-ranked EDA notebooks for the Titanic dataset to see diverse approaches and visualizations.