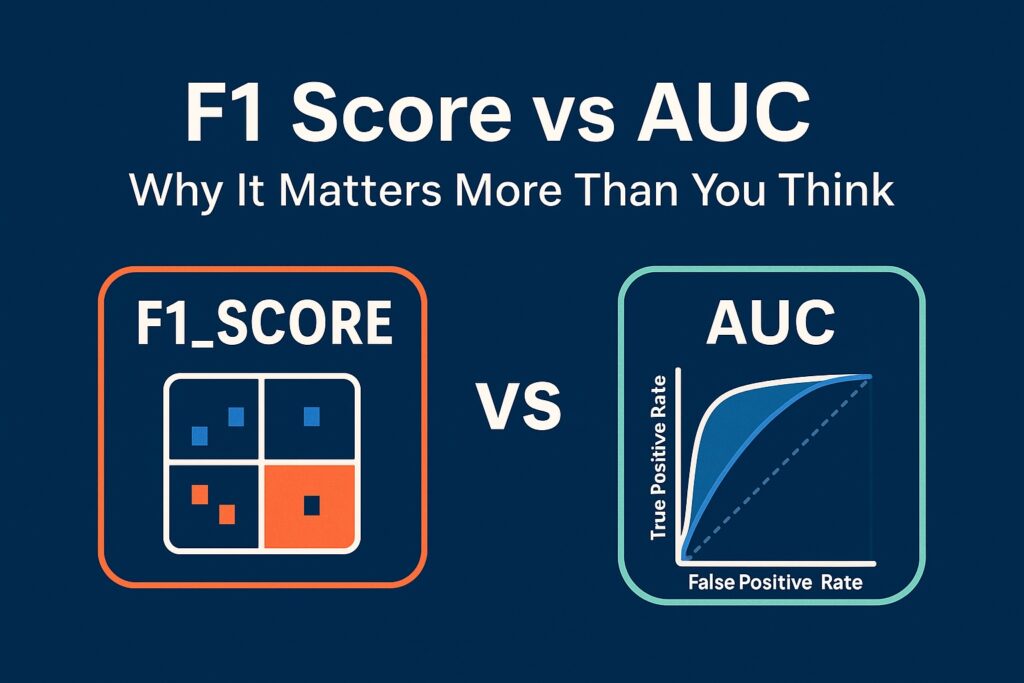
Introducing F1 Score vs AUC
Ladies and Gentlemen, we have in one corner F1 Score and in the other corner AUC. That’s right, you are about to watch F1 Score vs AUC. We have these two contenders because accuracy gets knocked out when we have imbalanced datasets. Seriously, it is misleading because correct predictions on the majority class mask poor performance on the minority class. Capturing nuances is the name of the game, with F1 Score and AUC coming out swinging in balancing false positives and false negatives.
Let’s meet the contenders that measure ML model performance beyond accuracy. Our F1 Score combines precision and recall into a single metric to evaluate classification performance. Its knockout move is its effectiveness on imbalanced datasets, where accuracy gets exposed and falls short. However, AUC (Area Under the ROC Curve) can measure how well a model ranks positive instances higher than negative ones. They are both widely used to assess classification models, but capture different aspects of performance.
Next, we’ll break down the differences between F1 Score and AUC—and show when and why to use each. It is vital to choose the right metric because it directly influences how we interpret model performance and make real-world decisions.
If you’re building a broader machine learning evaluation workflow, it also helps to understand how these metrics connect with related techniques such as feature selection with scikit-learn, PCA using scikit-learn, and ranking models in machine learning.
Quick Answer: When Should You Use F1 Score vs AUC?
Need a quick recommendation? Choose the metric below based on your evaluation goal.
| Evaluation Goal | Use |
| Fixed decision threshold | ✅ F1 Score |
| Compare multiple models | ✅ AUC |
| Rank predictions | ✅ AUC |
| Production classification | ✅ F1 Score |
| Tune thresholds later | ✅ AUC |
| Spam filtering | ✅ F1 Score |
| Fraud detection ranking | ✅ AUC |
Rule of thumb:
Use F1 Score when your classification threshold is fixed.
Use AUC when comparing models or ranking predictions across multiple thresholds.
Understanding F1 Score
To better evaluate F1 Score vs AUC, we first need to have the F1 score explained to us. Basically, F1 Score is the harmonic mean of precision and recall, balancing both these metrics within a single metric. Particularly, it ranges from 0 to 1, with higher values indicating better performance on both false positives and false negatives. Significantly, it is useful whenever we need to balance between precision and recall, especially with imbalanced data.
The F1 Score balances between precision and recall by penalizing extreme values of either precision or recall. Therefore, it encourages a balance between the two. Specifically, it achieves this by using the harmonic mean, which is lower than the arithmetic mean whenever there is an imbalance. Subsequently, a high F1 Score is only possible when both precision and recall are high. Consequently, when either precision or recall drops significantly, the F1 Score will reflect that drop more sharply.
To demonstrate this, we consider a confusion matrix that shows true positives, true negatives, false positives, and false negatives.
Here we have a binary classification that predicts 90 true positives and 10 false negatives, giving a high recall. However, the model also predicts 20 false positives, resulting in a drop in precision despite good recall. Subsequently, the F1 Score captures this trade-off by combining precision and recall into one value.
? Metric Calculations
Precision:
Precision = TP / (TP + FP) = 90 / (90 + 20) =
0.818
Recall:
Recall = TP / (TP + FN) = 90 / (90 + 10) =
0.9
F1 Score:
F1 = 2 × (Precision × Recall) / (Precision + Recall)
= 2 × (0.818 × 0.9) / (0.818 + 0.9) ≈
0.857
F1 Score shines on its home ground when models must classify imbalanced classes. This is especially true in situations where false positives and false negatives have different costs. It comes out swinging when a model needs a balanced measure that doesn’t let either precision or recall dominate the evaluation.
Understanding AUC (Area Under the Curve)
Continuing our evaluation of F1 Score vs AUC, we need to understand AUC better. What is AUC? Well, AUC stands for Area Under the Curve and indicates the area under the ROC curve. Specifically, the ROC curve is a plot of the true positive rate against the false positive rate for various threshold settings. Therefore, the AUC measures the model’s ability to rank positive instances higher than negative ones across all thresholds. While AUC summarizes the performance represented by an ROC curve as a single value, ML engineers often compare ROC curves with Precision-Recall curves when selecting the most appropriate evaluation method, particularly for imbalanced datasets. Learn more in our article on ROC Curve vs Precision-Recall Curve Explained for ML Models.
Furthermore, the AUC reflects the probability that a randomly chosen positive instance will rank higher than a randomly chosen negative one. Therefore, it captures the trade-off between the true positive rate and false positive rate across all classification thresholds. Subsequently, a higher AUC signifies that the model is better at distinguishing between positive and negative classes.
However, a concrete example helps explain this idea — as illustrated by the diagram below.
ROC Curve Comparison
AUC = 0.5 (Random)
AUC = 0.85 (Good)
Here, the AUC of 0.5 is a diagonal that indicates that the model performs no better than random guessing. However, an AUC of 0.9 means that the model does an excellent job separating between positive and negative classes. In the illustration above, the AUC of 0.85 means there’s an 85% chance the model ranks a randomly chosen positive instance higher than a negative one.
When is AUC the better choice vs F1 Score? It’s most appropriate when the goal is to rank positive instances higher than negative ones. Subsequently, it is ideal when we evaluate models across all classification thresholds, not just a fixed point. This is especially useful whenever we tune the decision threshold or vary it by use case.
One real-world example is credit fraud detection, where the model ranks transactions by risk. In this example, engineers adjust the threshold based on investigation costs or alarm tolerance.
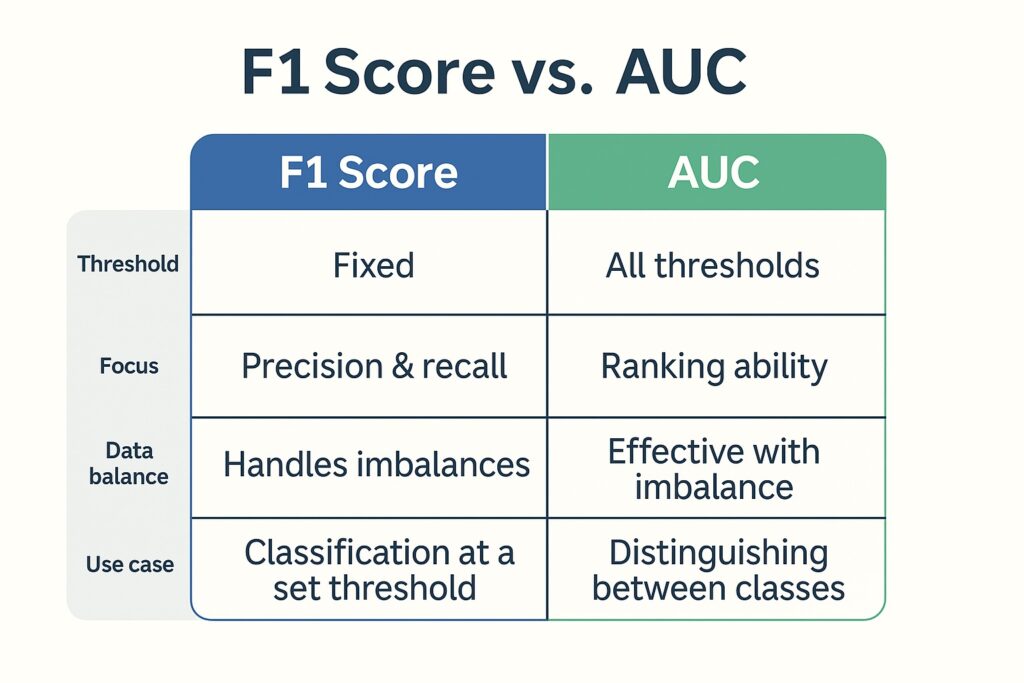
F1 Score vs AUC: Key Differences
The F1 Score vs AUC comparison heats up as we consider their key differences in machine learning model evaluation.
F1 Score vs AUC Direct Metric Comparison
The foremost difference is that the F1 Score focuses on the balance between precision and recall at a specific threshold. In contrast, AUC evaluates how well the model ranks positives above negatives across all thresholds. This ranking ability is commonly visualized using the ROC curve. However, when datasets are highly imbalanced, Precision-Recall curves often provide a more informative view of classifier performance. For a detailed comparison of these evaluation approaches, see ROC Curve vs Precision-Recall Curve Explained for ML Models. Meanwhile, F1 is sensitive to the chosen decision threshold, whereas AUC is threshold independent. Another way to consider this is that AUC measures ranking performance while F1 measures classification performance. Therefore, the F1 Score is better for models that perform decision-making with fixed thresholds. On the other hand, AUC is better for comparing models holistically.
Furthermore, the F1 Score is more interpretable for binary yes/no decisions, especially in production settings. Meanwhile, AUC is more robust when evaluating models on imbalanced datasets with varying thresholds. However, under extreme class imbalance, Precision-Recall AUC (PR AUC) often provides a clearer picture of model performance than ROC AUC.
F1 Score vs AUC Scenarios
Whenever a fixed classification threshold is in use, the F1 Score outperforms AUC — such as in email spam filters that mark messages as spam if the probability is above 0.7. However, AUC will win over the F1 Score whenever the decision threshold is tuned later — for example, in credit card fraud detection systems that adjust sensitivity based on investigation resources.
Whenever false positives and false negatives carry similar costs, the F1 Score performs better than AUC — for example, classifying customer support tickets as urgent or non-urgent, where both mistakes delay service. In contrast, AUC is far more suitable when these costs vary greatly, such as in cancer screenings where missing a positive case is much more severe than a false alarm.
In real-time classification scenarios, F1 Score vs AUC comparisons often show the F1 Score winning — as in detecting network intrusions in cybersecurity systems to block threats instantly. However, AUC beats the F1 Score with model selection before deployment. Therefore, it is ideal for evaluating machine learning models as recommendation systems before selecting which one to launch.
Summary
F1 Score vs AUC — Pros & Cons
✓ = relative strength, ~ = situational/neutral
Applying this in real machine learning systems?
Once you understand the trade-offs between F1 Score and AUC, the next step is applying them in real-world ML systems. These are the resources I personally recommend for going deeper into model evaluation and practical ML implementation.
These are particularly useful when working with imbalanced datasets, threshold tuning, model selection, and production evaluation pipelines.
• Hands-On Machine Learning with Scikit-Learn, Keras, and TensorFlow
• Learning from Imbalanced Data
These resources provide a strong foundation before moving into production monitoring and real-world deployment scenarios.
If you prefer structured, hands-on learning, platforms like Pluralsight provide guided courses on model evaluation, classification metrics, and machine learning workflows.
Which Metric Should You Use?
We now show you when to place your bet on the F1 Score and when to place your bet on AUC. Therefore, we provide a set of decision criteria on how to place your bets.
Imbalanced Dataset
Whenever you have an imbalanced dataset, AUC is generally more stable across different thresholds. However, F1 Score remains valuable when precision and recall are equally important. Also, AUC excels in ranking ability when class proportions are skewed. Additionally, when there is extreme imbalance, Precision-Recall AUC may outperform ROC AUC because it places greater emphasis on minority-class detection. For a detailed explanation of when to choose ROC curves versus Precision-Recall curves, see ROC Curve vs Precision-Recall Curve Explained for ML Models. Specifically, severe imbalance does require focusing on metrics that prioritize minority class detection. Therefore, AUC ROC or PR AUC are often preferable to F1 Score for imbalanced datasets.
Threshold Tuning
We will now consider scenarios where you can tune the decision threshold. Here, it is better to place your bets on AUC in the AUC or F1 Score contest. Since AUC evaluates performance across all thresholds, it is ideal for flexible tuning. Whereas the F1 Score only reflects performance at a specific threshold, which limits its usefulness whenever thresholds change.
Threshold tuning is invaluable since it allows engineers to optimize for precision, recall, or a balance that AUC well supports. Consequently, AUC becomes helpful in model selection before deciding upon the final threshold. Otherwise, when the threshold is fixed and we cannot tune it, then F1 Score is better suited as a performance measure.
Ranking More Important than Absolute Classification
Whenever models need to rank positive instances over the negative ones, rather than exact classification, then AUC is better than F1 Score. Primarily, AUC measures how well the model orders predictions regardless of the threshold used. Because the F1 Score focuses on classification accuracy at a single threshold, it is less useful for ranking scenarios. Therefore, ranking algorithms like recommendation systems align more closely with AUC than F1 Score.
AUC vs F1 Score – Real-World Case Examples
Here, we elaborate on earlier use cases to show AUC vs F1 Score in the real world.
Fraud Detection
Machine learning is used to identify suspicious transactions in real-time to prevent financial losses. Here, AUC revealed the model’s ability to rank high-risk transactions over legitimate ones, even at varying thresholds. Conversely, the F1 Score demonstrated poor precision even with good recall rates, causing false alarms resulting in higher costs. Because AUC captured overall ranking quality, it demonstrated that the model was still valuable for prioritizing investigations. However, the F1 Score could pinpoint threshold-specific trade-offs that directly impacted fraud alert handling. Overall, AUC was superior for model selection while F1 Score guided operational decision thresholds.
Spam Filtering
Widespread ML application is spam filtering that automatically classifies emails as spam or legitimate to prevent everyone’s email boxes from getting clogged. Applying F1 Score revealed that high recall came at the expense of low precision, resulting in false positives on legitimate emails. However, AUC demonstrated that the model could still rank spam above legitimate messages across multiple thresholds. Here again, F1 Score could pinpoint the exact threshold where spam detection was most balanced. Therefore, an AUC-guided model selection is performed before applying threshold tuning for optimal spam filtering performance.
When Model Evaluation Becomes a System Design Decision
In real-world systems, choosing between F1 Score and AUC is not just a metric decision—it directly impacts model behavior, cost, and operational outcomes. However, performance metrics only show how well a model performs; they do not explain which inputs are driving its predictions. Feature importance provides this complementary perspective by identifying which features have the greatest influence on model behavior.
In production environments, these metrics are often monitored over time to detect model drift, data quality issues, and performance degradation. This connects model evaluation with observability tools such as CloudWatch, Datadog, and Prometheus. For a broader comparison of those platforms, see CloudWatch vs Datadog vs Prometheus.
These pipelines also depend on broader cloud architecture decisions, especially where security, monitoring, and data movement intersect. For a deeper architecture-first view, see AWS Infrastructure Security: Why Architecture Comes First.
- Hands-On Machine Learning with Scikit-Learn, Keras, and TensorFlow by Aurélien Géron
- Learning from Imbalanced Data by Haibo He & Yunqian Ma
How These Metrics Are Monitored in Production
In real-world systems, F1 Score and AUC are not static metrics. They are part of broader data processing and machine learning pipelines, where performance must be monitored continuously over time.
This allows engineers to detect model drift, changing data distributions, and performance degradation before they impact business outcomes or user experience.
These trends are typically tracked using observability platforms such as CloudWatch, Datadog, and Prometheus, where alerts can trigger investigation workflows, retraining pipelines, or threshold adjustments.
AUC vs F1 Score – The Final Verdict
The judges have submitted their assessments, and now we see their decisions. We saw that the F1 Score can measure the balance between precision and recall at a fixed threshold. However, AUC was able to evaluate a model’s ability to rank positives above negatives across all thresholds. Whenever false positives and false negatives carry a similar cost, then F1 is the winner. But when ranking quality matters more than classification at a single cutoff, then AUC stands out.
But why is there a contest when using both these metrics together provides a full picture of model performance? AUC vs F1 Score, it’s a tie!!
Further Learning: F1 Score vs AUC in Real-World ML Systems
If you’re applying these evaluation metrics in production machine learning systems, the following resources are the ones I would personally use to go deeper into model evaluation, imbalanced data, and practical ML workflows:
Pattern Recognition and Machine Learning by Christopher Bishop
Hands-On Machine Learning with Scikit-Learn, Keras, and TensorFlow by Aurélien Géron
Learning from Imbalanced Data by Haibo He & Yunqian Ma
Disclosure: This post contains affiliate links. If you purchase through these links, we may earn a commission at no additional cost to you. We only recommend products we believe will add value to our readers.