Introduction
Monitoring is a critical capability for modern cloud systems that are invariably distributed, making them complex and prone to failure and inefficiencies. This makes visibility critical and necessitates observability tools that provide metrics, logs, and traces for informed management and decision-making. Two widely used tools are Prometheus and CloudWatch, one of which is open-source and the other is AWS-native. For a broader comparison of monitoring tools across AWS-native, multi-cloud, and Kubernetes environments, see our guide on monitoring tools across AWS-native and Kubernetes environments. These different approaches to monitoring and architecture are referred to as Prometheus vs CloudWatch in their selection. This results in trade-offs in flexibility, scalability, and management. The implications are that choosing the right tool will impact performance, cost, and operations.
While this article focuses on Prometheus vs CloudWatch, many environments require evaluating multiple monitoring tools. For a broader comparison across AWS monitoring solutions, see CloudWatch vs Datadog vs Prometheus. These are critical considerations for architects and engineering teams. This article compares features, architectures, and use cases to help practitioners decide which tools fit their environment.
What Is Prometheus?
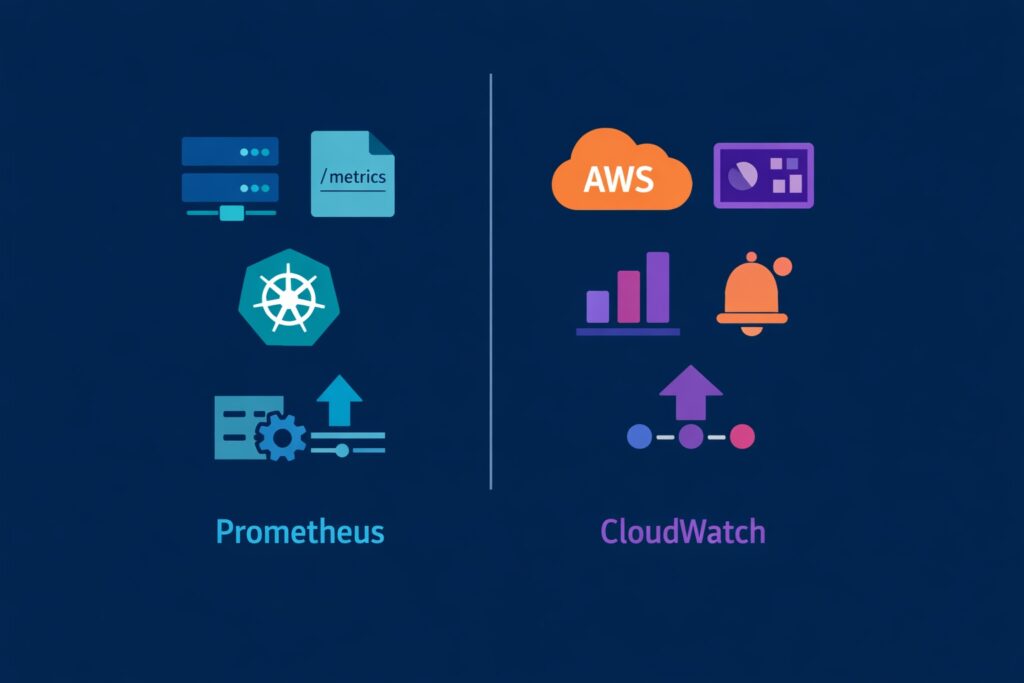
Prometheus is an open-source monitoring and alerting system that is widely used in modern infrastructure environments. This especially includes public cloud infrastructure like AWS. It primarily collects and stores metrics from running services using time series data as the central storage model. As a result, it uses a custom time-series database that also supports querying and analysis of time-based metric data. Another differentiating characteristic is that Prometheus implements the pull-based collection model. This involves scraping targets at intervals to have greater control at the monitoring layer. However, pull-based collection is optimal when targets expose metric endpoints. This affects deployment and monitoring choices as part of Prometheus vs CloudWatch. These characteristics make Prometheus a popular choice in cloud-native environments for engineers seeking flexibility and extensibility alongside Kubernetes deployments.
Prometheus is widely adopted in cloud-native environments that support modern infrastructure patterns, including containerization, and is well-suited to it. This is especially applicable to Kubernetes, which integrates closely with Prometheus, making it a common choice for containerized workloads. Another distinct advantage is the support for flexible metric collection and querying. This allows teams to tailor monitoring to their specific requirements. Additionally, a broader ecosystem supports Prometheus, enabling exporters and integrations to extend visibility into many systems. As a result, Prometheus is well adapted for teams managing dynamic services or container platforms, as it integrates well with them. However, operational trade-offs are associated with these strengths that architects must weigh when selecting between Prometheus vs CloudWatch.
What Is CloudWatch?
CloudWatch is an AWS-native monitoring and observability service that is an integral part of the AWS platform. The foundational aspect of CloudWatch is that it handles metrics, logs, alarms, and dashboards, providing visibility to AWS services. Another core attribute is that CloudWatch directly integrates with AWS services, and AWS resources can emit telemetry into it. A key distinction from Prometheus vs CloudWatch is that CloudWatch telemetry uses the push-based model. This contrasts with Prometheus scraping data from services to collect their monitoring data. CloudWatch’s core role in AWS day-to-day operations is centralizing monitoring data for visibility and alerting. CloudWatch is primarily applicable for AWS-first environments and is the default selection in such architectures.
Another key aspect of CloudWatch is that it is a fully managed AWS service where teams do not manage monitoring infrastructure directly. As a result, CloudWatch scales with AWS environments, freeing teams from the operational burden of managing CloudWatch. Because CloudWatch is AWS native, it works closely with AWS services and tooling, which simplifies monitoring across AWS resources. This simplifies AWS operations since CloudWatch integrates visibility, alerting, and dashboards into one platform, enabling day-to-day ease of use. This makes CloudWatch especially effective for AWS-first environments supporting use cases primarily implemented on AWS. As AWS environments evolve from traditional EC2 workloads toward container platforms like ECS and EKS, monitoring and operational responsibilities also change. See EC2 vs ECS vs EKS: Why AWS Compute Security Isn’t the Same. However, there are important trade-offs, especially in enterprises where AWS environments are alongside a multi-cloud environment, and enterprises require customizable observability.
If you want to go deeper into CloudWatch metrics, then refer to CloudWatch Metrics Dimensions: Best Practices That Prevent Cardinality Chaos.
Prometheus vs CloudWatch Monitoring: Key Differences
Data Collection Model
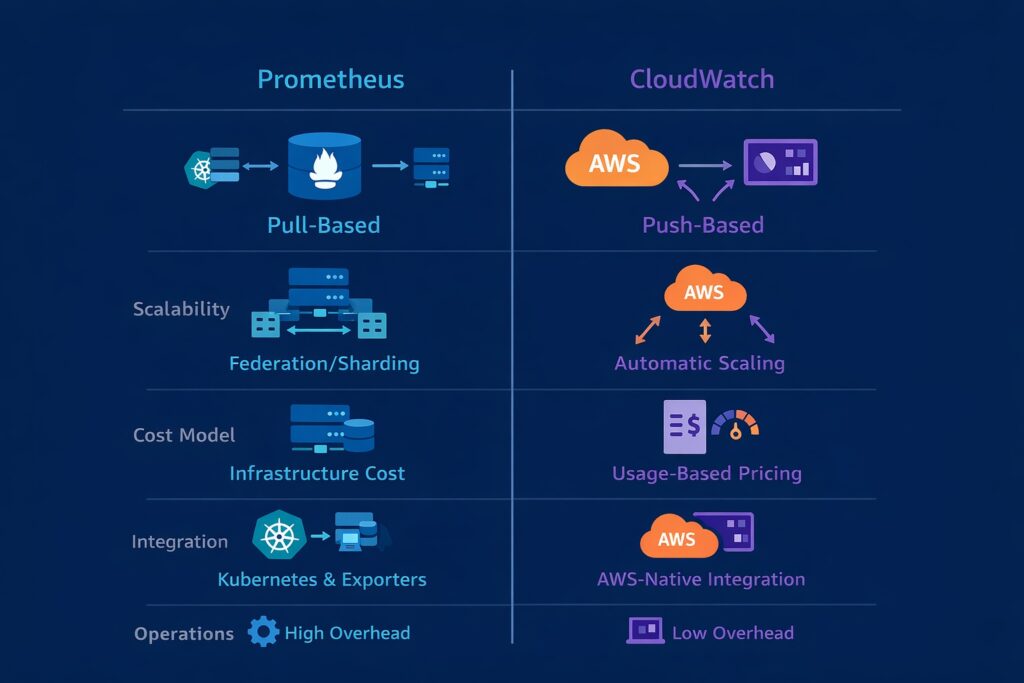
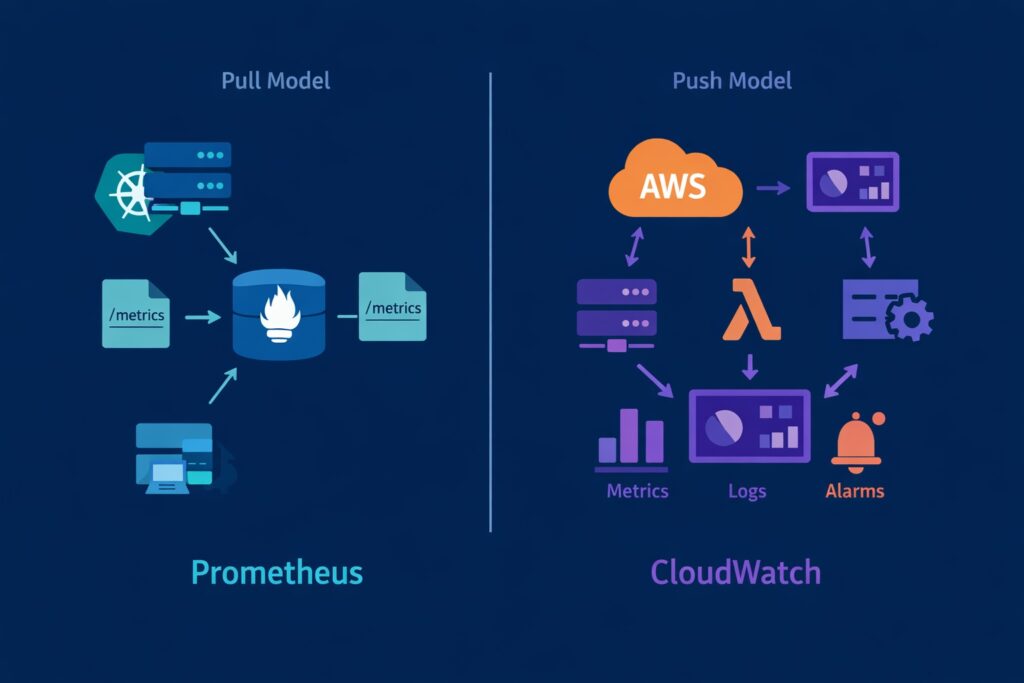
The key differentiation between Prometheus vs CloudWatch is the data collection model, which is the pull data model vs the push data model. Prometheus uses the pull-based model, where it scrapes metrics from targets at intervals, typically through their APIs. In contrast, CloudWatch uses a push-based model where integrated AWS services send their telemetry data to CloudWatch. Additionally, Prometheus is centralized and responsible for data collection, whereas CloudWatch is decentralized, with AWS services responsible for sending telemetry data. These tools influence architecture, whether services expose endpoints for collection, or services actively publish telemetry data. This also impacts failure detection and visibility, and how missing data is interpreted.
For a broader comparison that includes SaaS-based observability platforms alongside AWS-native and open-source monitoring, see CloudWatch vs Datadog vs Prometheus.
Metrics and Data Storage
Another significant differentiator between Prometheus vs Cloudwatch is how they store and manage metrics, especially for querying. Prometheus stores metrics in its built-in time-series database (TSDB) to store them locally with time-based indexing. In contrast, CloudWatch stores metrics in a managed AWS service that abstracts storage from the user. Retention is another key differentiator, which is configurable for Prometheus but is tier-based and predefined for CloudWatch. Granularity differences are also significant, with Prometheus having high and fixed granularity based on scrape intervals. In contrast, CloudWatch’s granularity depends upon metric type and retention tier. These differences for Prometheus vs CloudWatch have implications for querying, analysis, and monitoring strategies.
Scalability and Performance
Scalability and performance are another dimension in the difference between Prometheus vs CloudWatch, and in their selection. Prometheus scales horizontally to increasing metrics using federation or sharding, but this scaling requires additional hardware. Since CloudWatch is AWS-native, it scales automatically as a managed service with scaling handled by AWS. Critically, Prometheus performance can degrade under load, but CloudWatch remains reliable, with less visibility into performance tuning. This also translates into operational complexity, with Prometheus requiring significant management overhead for tuning, whereas CloudWatch is abstracted from the user. These differences significantly influence architectural decisions on investment in hardware and operational capacity.
Integration and Ecosystem
The ecosystem significantly influences the choice between Prometheus vs CloudWatch for observability and how they integrate with it. Prometheus strongly integrates with ecosystems comprising cloud-native tools and with Kubernetes and exporters as key components. Here, exporters collect metrics from other services and expose them in a format that Prometheus can scrape. Conversely, CloudWatch integrates natively with AWS services, allowing seamless telemetry across AWS resources. These integration models differ in terms of openness, with flexibility vs native integration, but with tight coupling. Teams implementing Prometheus must actively integrate it with services and perform ongoing management; this effort is virtually nonexistent for CloudWatch.
Organizations evaluating whether deeper observability capabilities justify moving beyond AWS-native tooling should also compare CloudWatch with enterprise observability platforms. See CloudWatch vs Datadog. However, architects should also evaluate how telemetry ingestion, retention policies, and advanced observability features influence long-term operational costs as environments scale. For a detailed pricing analysis, see How Much Does Datadog Cost? The Real Pricing Breakdown.
Cost Considerations
This is always critical for any architecture, and the cost considerations for Prometheus vs CloudWatch differ significantly. Prometheus’s cost driver is the infrastructure it runs on, including compute, storage, and operational overhead. Meanwhile, CloudWatch’s cost driver is usage-based pricing, which comprises metrics, logs, and API usage. Enterprise observability platforms introduce additional considerations such as host-based billing, telemetry ingestion, APM usage, and retention policies that can significantly influence monitoring costs at scale. For a detailed breakdown of enterprise observability pricing considerations, see How Much Does Datadog Cost? The Real Pricing Breakdown. There is also predictability where CloudWatch is variable, as telemetry data scales, however, Prometheus is predictably based on fixed infrastructure. Prometheus requires significant operational effort due to management overhead, contributing to costs. However, there are no management overhead costs associated with CloudWatch.
Architecture Differences Between Prometheus and CloudWatch
Self-Managed vs Fully Managed Architecture
Architectural modeling is a core difference between Prometheus vs CloudWatch, contrasting between self-managed vs fully managed. Prometheus is a self-managed architecture model in which teams are responsible for deploying and operating the monitoring infrastructure. CloudWatch is at the other end of the spectrum since it is a fully managed AWS service where AWS operates the monitoring infrastructure. These differences translate into control vs abstraction, where teams have complete control over Prometheus, but Cloudwatch is abstracted by AWS. Another perspective is that teams have full ownership and responsibility for Prometheus, whereas AWS retains ownership and responsibility over CloudWatch. It follows that these architectural differences drive deployment and operational considerations.
Deployment Complexity and Operational Overhead
Architectural modeling is core to Prometheus vs CloudWatch, as it directly influences deployment and operational complexity. Prometheus requires teams to assume responsibility for the deployment, configuration, and scaling of monitoring components as well as infrastructure setup. However, none of this is needed for CloudWatch, since it reduces complexity as a managed service with minimal infrastructure involvement. The two architectural approaches also have implications for high availability (HA), with teams managing HA or AWS managing resilience. This also influences fault tolerance, where teams have to manage fault tolerance, but AWS abstracts this away from users. These differences become more significant at scale.
Enterprise Architecture and Observability Pipelines
The implications for Prometheus vs CloudWatch become far more significant within enterprise environments as they scale. Teams must coordinate Prometheus across multiple environments and set up either a federated or a distributed implementation across the enterprise. CloudWatch is relatively easy to use across the enterprise since it integrates with AWS multi-account and multi-region setups, leveraging native AWS capabilities. AWS abstracts CloudWatch across distributed environments, whereas teams have to manage and monitor Prometheus. Teams have to consider each one in terms of how it fits into observability pipelines and integrates with external systems. These architectural considerations significantly influence trade-offs when selecting one tool over another. As observability pipelines scale across enterprise environments, organizations must also account for how telemetry growth, retention strategies, and advanced monitoring capabilities affect long-term operational costs. For a deeper enterprise pricing perspective, see How Much Does Datadog Cost? The Real Pricing Breakdown.
For a broader architectural decision framework spanning AWS-native, enterprise, and Kubernetes monitoring models, see Best Monitoring Tools for AWS.
When to Use Prometheus vs CloudWatch
Use Prometheus When
Prometheus vs CloudWatch favors Prometheus when environments require flexibility and control. Also, environments that Prometheus naturally aligns with, including Kubernetes-heavy or containerized environments. For teams running containerized AWS workloads, understanding the shared security responsibilities across EC2, ECS, and EKS is equally important. Refer to EC2 vs ECS vs EKS: Why AWS Compute Security Isn’t the Same. Additionally, Prometheus emphasizes control over data collection, making it well-suited for custom metrics and fine-grained monitoring. Furthermore, Prometheus is more compatible with hybrid and multi-cloud setups and also provides independence from a single vendor. However, teams should have operational maturity since they need to manage infrastructure and monitoring systems. Therefore, when control and customization outweigh operational overhead, then Prometheus is the better choice.
Use CloudWatch When
Prometheus vs CloudWatch favors CloudWatch for AWS-first environments or environments predominately AWS. CloudWatch is AWS-native and has tight integration with AWS services, with seamless telemetry advantage that makes it most suited to AWS ecosystems. This reduces operational burden for teams that prefer managed services. This extends to automatic scaling and AWS-managed reliability, which is critical for production environments. Also, deployment is simple and requires minimal infrastructure management, allowing teams to focus on more valuable activities. Therefore, CloudWatch is the ideal choice when simplicity and AWS alignment outweigh flexibility.
To evaluate how CloudWatch compares against full-stack observability platforms in enterprise environments, see CloudWatch vs Datadog.
Pros and Cons of Prometheus vs CloudWatch
| Aspect | Prometheus | CloudWatch |
|---|---|---|
| Architecture | Self-managed | Fully managed by AWS |
| Data Collection | Pull-based scraping | Push-based telemetry |
| Storage Model | Built-in TSDB | Managed AWS metrics storage |
| Retention | Configurable | Tiered and predefined |
| Granularity | Fixed and high-resolution | Varies by metric type and retention tier |
| Scalability | Requires federation or sharding | Scales automatically |
| Performance Under Load | Can degrade without tuning | AWS-managed and stable |
| Integration | Strong Kubernetes and exporter ecosystem | Native AWS service integration |
| Multi-Cloud Fit | Well suited to hybrid and multi-cloud | Best suited to AWS-first environments |
| Operational Overhead | Higher management burden | Low operational overhead |
| Cost Model | Infrastructure and operational cost | Usage-based pricing |
| Best Fit | Custom, flexible, cloud-native monitoring | Simple AWS-native monitoring |
Conclusion
This article evaluated Prometheus vs CloudWatch and determined that the choice is contextual without a one-size-fits-all winner. The choice between Prometheus vs CloudWatch highly depends on first articulating the architecture, operational model, and team maturity. Prometheus’s strengths lie in its flexibility, customization, and support for cloud-native or multi-cloud environments. However, CloudWatch’s strengths incline towards simplicity, AWS-native integration, and managed operations. Therefore, these monitoring tools should align with system design and operational responsibilities when making a selection. Therefore, it is extremely important to choose the tool that best matches the environment and long-term observability goals. For a complete decision framework across CloudWatch, Datadog, and Prometheus, refer to our guide on decision framework for AWS monitoring tools
.