CloudWatch vs Datadog: Introduction
CloudWatch vs Datadog requires thoughtful consideration when including AWS monitoring as part of any architecture. The primary consideration is whether to use native AWS observability versus a full-stack third-party platform. Architects need to weigh architecture, scale, and visibility needs when making a selection. For a deeper understanding of how architecture defines security and observability outcomes, see AWS Infrastructure Security: Why Architecture Comes First.
Architectural decisions invariably involve trade-offs, and CloudWatch vs Datadog is no exception. Here, trade-offs involve simplicity, depth of observability, and operational overhead. Architects must also consider the impact of single-cloud versus multi-cloud environments on monitoring strategy. Enterprises adopting multi-cloud are far more the norm than the exception. Cost considerations inevitably rise to the foreground as systems scale across metrics, logs, and traces.
Therefore, this article will map a clear comparison of features, pricing, and architectural trade-offs. It will then provide practical guidance for selecting the right monitoring tool. This will feed into a decision framework tailored to real-world AWS environments for making informed decisions. For a broader comparison across AWS monitoring tools, see CloudWatch vs Datadog vs Prometheus, or refer to our guide on comparing monitoring tools in AWS environments.
What Is Amazon CloudWatch?
Core Features of CloudWatch
CloudWatch is AWS’s native observability platform that collects metrics, logs, and events across AWS services. This also includes real-time monitoring with alarms and automated responses to events. Its single most significant advantage is its native integration with AWS services and infrastructure. Additionally, it provides centralized visibility across the AWS environment for resource performance and operational health.
Strengths of CloudWatch
Architects need to weigh CloudWatch strengths when considering CloudWatch vs Datadog. Seamless integration with the AWS ecosystem and services is the biggest driver for any decision favoring CloudWatch. Another important consideration is that it is a fully managed service with no infrastructure to provision or maintain. It is also cost-efficient for AWS-native workloads with a pay-as-you-go pricing model. Another key advantage is its built-in security and compliance aligned with AWS architectural best practices.
Limitations of CloudWatch
CloudWatch’s biggest drawback is its limited visibility across multi-cloud and non-AWS environments, which is the norm for any enterprise. While it provides dashboards, they only provide the basic widgets, and correlation across metrics, logs, and traces is heavily constrained. Although its pricing model is pay-as-you-go, it becomes complex as usage scales across logs and metrics. Also, CloudWatch fragments observability compared to full-stack monitoring platforms.
What Is Datadog?
Core Features of Datadog
Datadog is a comprehensive observability platform from the start, providing a unified collection of metrics, logs, and traces for full-stack observability. It enables analytics through Application Performance Monitoring (APM) that allows tracing service dependencies and latency. They are complemented by real-time dashboards that enable customizable visualizations and alerting. Datadog’s key feature is its broad integration across cloud providers, containers, and third-party services. It also enables extensive correlation of telemetry data across infrastructures, applications, and user experiences.
Strengths of Datadog
Datadog brings some powerful capabilities to the CloudWatch vs Datadog debate. The most important one is unified observability across metrics, logs, and traces within a single platform. This is supported by strong visualization with customizable dashboards along with real-time insights. Additionally, its extensive integrations supporting multi-cloud and hybrid environments are an important consideration for most enterprises. Also, the advanced correlations and analytics it provides are becoming a necessity for faster troubleshooting and root cause analysis.
Limitations of Datadog
However, these are not without their downsides since all this power comes at a higher cost. This is especially prevalent at scale, due to per-host and feature-based pricing. Enterprises also have to weigh up dependency on a third-party platform for critical observability functions, thereby seeking ironclad arrangements. Also, these capabilities bring operational overhead in managing agents, integrations, and configurations. Moreover, as telemetry volume increases, so do data ingestion and retention costs.
CloudWatch vs Datadog: Key Differences
CloudWatch vs Datadog Features
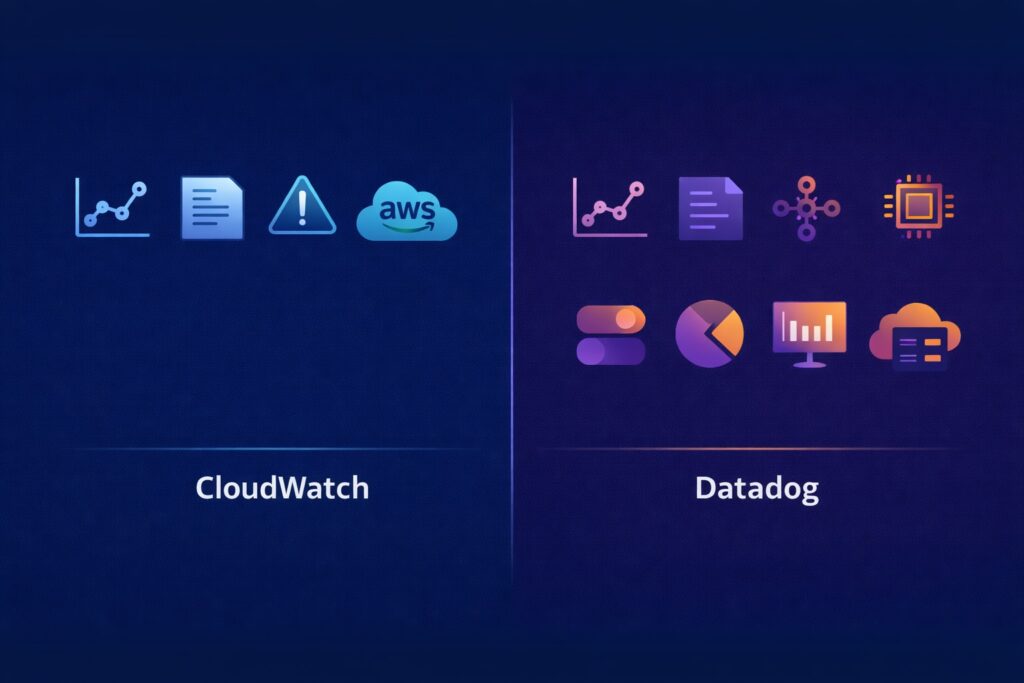
There are several axes that contrast CloudWatch vs Datadog, including native AWS monitoring versus a full-stack observability platform. However, the core difference is focus on metrics and logs versus metrics, logs, and traces with APM. There is also the architectural distinction between embedded AWS tooling and an external observability layer.
Closer examination shows that CloudWatch focuses on metrics, logs, and events tightly integrated with AWS services. In contrast, Datadog extends observability with metrics, logs, traces, and Application Performance Monitoring. Another critical distinction is that CloudWatch relies on AWS-native capabilities for monitoring and alerting workflows. Datadog differs significantly from this by providing cross-service correlation and deeper visibility across application layers.
In summary, there is a trade-off between simplicity with tight AWS integrations versus depth of observability and cross-platform visibility. Hence, selection is driven by whether requirements prioritize AWS-native monitoring or full-stack application insight.
To understand how these differences compare against open-source monitoring approaches, see CloudWatch vs Datadog vs Prometheus. For a deeper comparison of AWS-native telemetry versus Kubernetes-native monitoring, see Prometheus vs CloudWatch.
CloudWatch vs Datadog Performance and Scalability
Contrasting CloudWatch vs Datadog in terms of Performance and Scalability is characterized by several dimensions. The simplest contrast is the AWS-native scaling model versus an externally managed SaaS observability platform. However, the fundamental difference is between service-integrated monitoring and a data ingestion-driven architecture. Also, defining scalability by either AWS resource behavior or a platform capacity and pricing tiers.
These differences are illustrated by CloudWatch scaling automatically with AWS services as metrics and logs are generated natively. However, Datadog instead scales through agent-based data collection and centralized ingestion pipelines. In terms of performance, CloudWatch performance is tightly coupled to AWS infrastructure and regional service limits. On the other hand, Datadog’s performance depends on ingestion volume, platform capacity, and data processing pipelines.
These differences present several trade-offs, firstly between seamless AWS-native scaling versus external platform flexibility. Another key trade-off is the cost implications of usage-based AWS metrics, compared to ingestion-based pricing models. These choices are influenced by workload scale, multi-cloud requirements, and operational complexity.
These architectural trade-offs become even more pronounced when comparing AWS-native telemetry with pull-based Kubernetes monitoring approaches such as Prometheus. See Prometheus vs CloudWatch.
CloudWatch vs Datadog Ease of Use
It is clear from CloudWatch vs Datadog that the simplicity of AWS-native tooling contrasts with the complexity of a full-featured observability platform. This extends to learning curve differences between basic monitoring workflows and advanced analytics capabilities. Additionally, having usability shaped by familiarity with AWS services versus the need for cross-platform visibility.
Another consideration is that CloudWatch offers straightforward setup and navigation within AWS, but with limited advanced customization. This contrasts with Datadog, which provides powerful dashboards and analytics but has a steeper learning curve and more configuration effort. Hence, CloudWatch vs Datadog presents a trade-off between ease of use for AWS-native teams and flexibility for complex, multi-service environments.
CloudWatch vs Datadog Integration Capabilities
Integration is a critical consideration for CloudWatch vs Datadog, especially with large enterprises. This is highlighted by AWS-native integration scope versus broad multi-cloud and third-party ecosystem coverage. Another key difference is between tightly coupled service integrations and extensible cross-platform connectivity. Hence, integration capabilities are shaped by either AWS-centric architectures or heterogeneous environments.
These differences are brought into focus where CloudWatch integrates natively with AWS services, enabling seamless monitoring within the AWS ecosystem. This is in contrast to Datadog supporting integrations across multiple cloud providers, containers, and third-party services, highly relevant to large enterprises. Reliance is another consideration with CloudWatch, relying on AWS service connectivity and APIs for data collection and monitoring workflows. Whereas Datadog has to unify telemetry from diverse infrastructure and application environments, it therefore uses agents and integrations.
Here, the trade-off is clearly between when AWS-only monitoring is sufficient and when broader integration is needed.
Organizations also evaluating Kubernetes observability and pull-based telemetry models should compare CloudWatch with Prometheus directly. See Prometheus vs CloudWatch.
CloudWatch vs Datadog Pricing Comparison
CloudWatch Pricing Model
AWS implements a pay-as-you-go pricing model for CloudWatch. This is based on the volume of metrics reported, logs recorded, and API usage. Therefore, usage costs are driven by the volume of data collected, stored, and analyzed. This pricing structure aligns with AWS service usage and monitoring activity applied to other services.
It is critical to understand how CloudWatch costs increase with usage when selecting tools. Here, costs increase with higher volumes of logs and metrics and higher monitoring frequency. Price remains easy to predict at small scale, but its predictability becomes more difficult as usage grows. Furthermore, log-heavy workloads and high-frequency metrics will significantly impact overall cost.
Datadog Pricing Model
Datadog’s pricing model differs from CloudWatch in that it implements a subscription-based pricing model that is built around per-host and per-feature usage. It also supports separate pricing tiers for infrastructure monitoring, APM logs, and additional capabilities. It structures its costs around enabled features and the scope of observability required.
Here, it is important to understand how DataDog’s costs increase with usage. Again, it differs from CloudWatch in that costs increase with the number of hosts, enabled features, and volume of ingested data. Additionally, pricing becomes less predictable when organizations layer on additional services like logs and APM. Also, architectures with high ingestion and large-scale environments can significantly amplify costs. For a deeper breakdown of ingestion pricing, host-based billing, and how observability costs scale in enterprise environments, see How Much Does Datadog Cost? The Real Pricing Breakdown.
Cost Comparison at Scale
CloudWatch vs Datadog means that architects need to choose between AWS usage-based pricing with Datadog’s host plus ingestion-driven pricing. It is especially important to consider how cost behavior is shaped by telemetry volume, infrastructure footprint, and enabled features. Price divergence between the two tools is driven by how monitoring data is generated, collected, and retained.
As organizations grow and expand, it is critical that they understand how observability costs grow with ever-increasing workloads. CloudWatch costs will increase with high volumes of logs, metrics, and data retention requirements. In contrast, Datadog costs will grow with the number of hosts, enabled features, and ingestion of telemetry data. In both cases, log-heavy workloads and high-frequency monitoring will significantly amplify costs. However, different factors drive these cost increases.
Organizations are faced with the trade-off between lower costs using AWS-native loads with higher costs if they want deep observability capabilities. CloudWatch is typically more cost-effective for tightly scoped AWS environments, whereas broader visibility justifies Datadog’s costs. However, architects must weigh cost sensitivity against the need for full-stack, cross-platform observability when making a final decision. Organizations evaluating enterprise observability platforms should also understand how telemetry ingestion, retention policies, and feature enablement influence long-term platform costs. For a detailed analysis, see How Much Does Datadog Cost? The Real Pricing Breakdown.
For a broader cost and architecture comparison across all major monitoring approaches, see CloudWatch vs Datadog vs Prometheus.
Architecture Perspective: CloudWatch vs Datadog
AWS-Native Monitoring Architecture
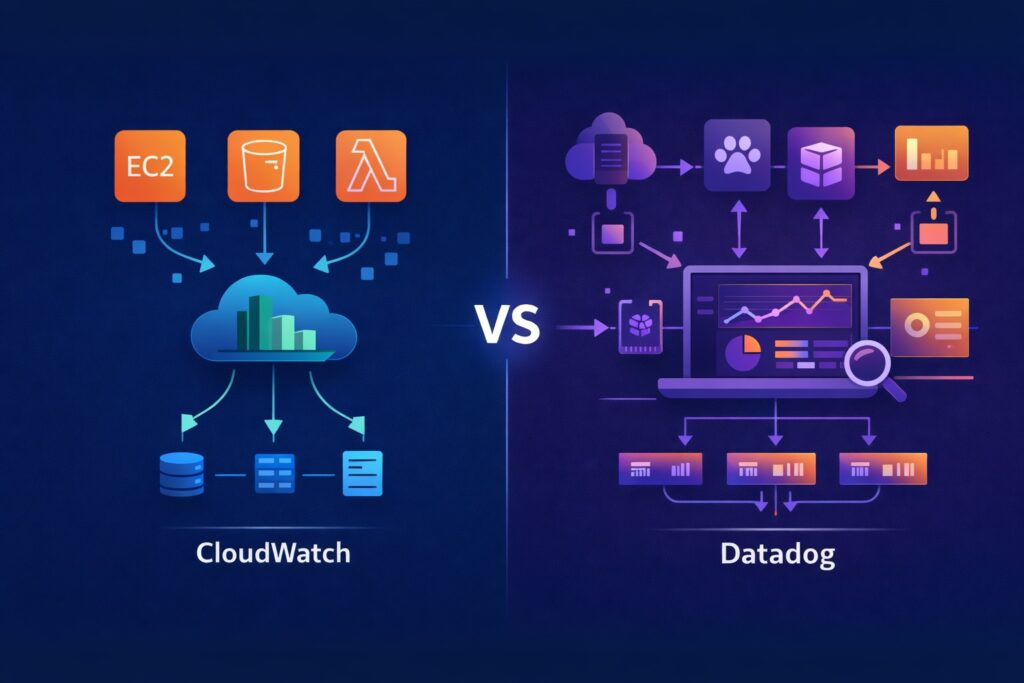
Through CloudWatch, AWS directly embeds observability with AWS services and infrastructure. This results in tight coupling between monitoring capabilities and the behavior of AWS resources. Furthermore, all data collection and alerting is driven by native AWS APIs and service events. A fully managed, service-integrated telemetry model minimizes operational overhead.
Third-Party Observability Architecture
Architecturally, Datadog sits at the other end of the spectrum from CloudWatch. It implements observability as an external, centralized platform independent of infrastructure. Also, it decouples architecture to enable aggregation of telemetry across multiple systems and environments. Additionally, it implements data collection through agents and integrations spanning cloud, containers, and applications. This includes a unified visibility layer designed for cross-platform monitoring and advanced analytics.
When Architecture Drives the Decision
There are several scenarios where the underlying observability architecture drives the decision between AWS-native monitoring and third-party observability. When an organization deploys to single-cloud AWS environments, then tightly integrated native observability is a better solution. However, when there are multi-cloud and hybrid architectures, then centralized, cross-platform monitoring capabilities are needed. This is especially true for enterprise systems with complex dependencies, which benefit from unified observability layers.
However, smaller or tightly scoped workloads align better with embedded, low-overhead monitoring approaches. Overall, architectural priorities, including scalability, flexibility, and operational complexity, will directly influence tool selection. These monitoring decisions also align closely with compute platform responsibilities across EC2, ECS, and EKS environments. For a deeper comparison of compute security models and operational boundaries, see EC2 vs ECS vs EKS: Why AWS Compute Security Isn’t the Same. This principle reinforces that architecture defines security and observability outcomes, as outlined in AWS Infrastructure Security: Why Architecture Comes First.
For architects evaluating AWS-native telemetry against Kubernetes-focused open-source monitoring, see Prometheus vs CloudWatch.
As observability architectures scale across multi-cloud and hybrid environments, organizations must also account for how telemetry growth impacts operational costs and monitoring platform pricing models. For a detailed breakdown of Datadog pricing behavior at scale, see How Much Does Datadog Cost? The Real Pricing Breakdown.
Recommended Learning Resources for CloudWatch and Datadog
Structured Learning for Observability and Monitoring
Choosing between CloudWatch and Datadog often highlights a broader learning gap in observability and monitoring practices. While each platform provides powerful capabilities, designing effective monitoring strategies across metrics, logs, and traces requires a deeper level of expertise.
Structured learning platforms provide a more guided approach to building these skills. These platforms offer courses covering observability, AWS monitoring, and distributed systems, enabling engineers to apply monitoring tools in real-world production environments. Platforms such as Pluralsight provide structured learning paths for AWS monitoring, observability, and distributed systems.
This type of learning is also useful for developing practical skills in alerting strategies, metrics design, and operational workflows that extend beyond tool-specific features. For foundational concepts, the official AWS observability documentation provides a useful reference point for understanding how monitoring integrates with cloud architectures.
Affiliate Disclosure
This article may include affiliate links to recommended tools and learning resources. We select these based on relevance and value to the audience, and they do not affect editorial integrity.