
How Much Does Datadog Cost? (Quick Answer)
Datadog pricing typically starts at $15 per host per month for the Pro plan, with Enterprise plans at $23 per host per month. A limited free tier is available, but most production environments require paid plans for full observability features. Costs increase because Datadog charges separately for logs, APM, custom metrics, and other add-ons. Pricing scales as host count, log volume, trace volume, and metric cardinality grow across the environment. Smaller deployments may stay within a moderate range, while larger cloud environments can become significantly more expensive. Datadog can justify its cost for deep observability, but simpler AWS workloads may require less. If you are deciding whether Datadog is the right choice compared to AWS-native monitoring, see CloudWatch vs Datadog.
For the latest official pricing details, refer to the Datadog pricing page.
| Plan | Starting Price | What’s Included | Best For |
|---|---|---|---|
| Free | $0 | Basic metrics, limited features | Testing, small environments |
| Pro | $15 per host/month | Infrastructure monitoring, integrations | Most production workloads |
| Enterprise | $23 per host/month | Advanced analytics, support, features | Large-scale environments |
| Add-Ons | Varies | Logs, APM, custom metrics, synthetics | Drives most cost increases |
Datadog Pricing Model Explained
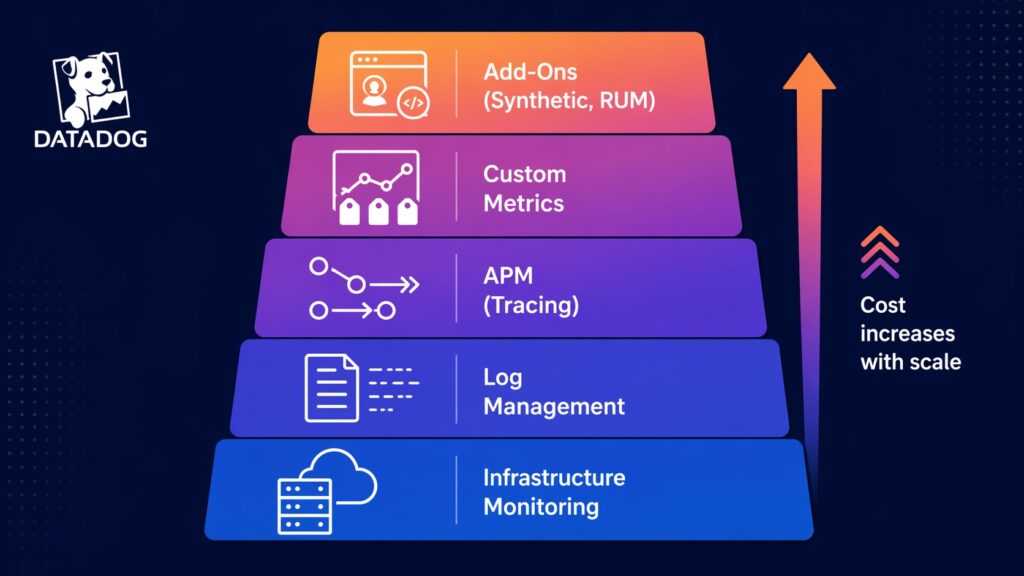
Datadog uses a modular pricing model rather than a single flat subscription across the entire platform. The platform combines host-based pricing with optional product add-ons, including infrastructure monitoring, applications, logs, digital experience, and software delivery. As a result, total spend depends on which products a team enables, not just the base plan.
When budgeting for Datadog, teams must account for both host-based charges and usage-based costs that grow with adoption. Many teams begin with infrastructure monitoring and then expand into logs, APM, synthetic monitoring, or other services over time. As telemetry volume and platform usage increase, pricing becomes harder to estimate from the entry plan alone. This is why understanding Datadog pricing requires evaluating both the base plan and the major add-on cost drivers.
Datadog Pricing Breakdown by Component
Infrastructure Monitoring
Infrastructure monitoring covers collecting system-level metrics from hosts, which are compute resources running the Datadog agent. Datadog pricing for infrastructure monitoring is based on a per-host model, with tiered plans such as Pro and Enterprise. In cloud environments, hosts typically include EC2 instances, virtual machines, or Kubernetes nodes where workloads are deployed. Under this model, costs increase as the number of hosts grows, particularly in autoscaling or dynamic environments. This forms the baseline cost layer, with additional charges applied for other observability services such as logs and APM.
Log Management
Log management collects log data that is typically events published by running processes and analyzes these events for insights. The pricing model for log management is based on ingestion volume, and not per host. This pricing model also depends on indexing and retention. Distributed systems invariably cause this log volume to grow quickly; this is further exacerbated by microservice scaling and high-traffic environments. As a result, logging with Datadog is often one of the largest cost components and requires additional attention given to cost management. This cost driver is often masked to teams who end up underestimating logging costs due to volume, verbosity, and duplication.
Application Performance Monitoring (APM)
Application performance monitoring (APM) tracks application performance and request flows, allowing execution tracing and service-level visibility. Its pricing model is tied to usage, which includes traces, services, or hosts, depending on its setup. Costs here will grow as trace volume increases with application traffic and the number of services, specifically in distributed systems and microservices. APM is highly valuable, as it provides deep visibility into performance and debugging, and its cost should be assessed against that of alternative solutions. Teams need to remember that high-traffic or complex systems generate large trace volumes when assessing APM from Datadog. Significantly, APM adds another cost layer to Infrastructure Monitoring and Log Management.
Custom Metrics
Datadog allows teams to define custom metrics in addition to the system metrics it provides by default. Pricing for custom metrics is based on the number of unique metrics rather than a host-based model. A key cost factor is metric cardinality, which represents the number of unique combinations of metrics and tags. As tags and dimensions increase, cardinality grows, especially in environments with microservices, multiple deployments, or user-level tagging. This growth is often not immediately visible, leading teams to underestimate the impact on Datadog cost.
As a result, poorly designed metrics and tagging strategies can cause costs to increase unexpectedly. Teams must carefully manage metric definitions and tagging practices to control this cost driver.
These metric cardinality challenges are also a major consideration in Prometheus environments, where labels and time-series growth can significantly affect observability scaling. For a deeper comparison of these monitoring models, see Prometheus vs CloudWatch.
Synthetic Monitoring & Other Add-Ons
Synthetic monitoring includes API testing, browser testing, and uptime checks, while add-ons include Real User Monitoring (RUM) and security features. Pricing is based on usage, typically measured per test execution or feature consumption. Costs increase with test frequency and the number of monitored endpoints, and continuous monitoring can cause costs to accumulate quickly. Each add-on introduces incremental cost, reflecting Datadog’s modular platform model, where enabling additional features increases overall spend.
Over time, teams often enable multiple add-ons as observability needs expand. As a result, total Datadog cost is best understood as the sum of all enabled components rather than a single pricing tier.
Real-World Datadog Cost Scenarios
Small AWS Workload
This represents the lowest-complexity baseline, consisting of a small AWS-first environment with limited infrastructure and modest traffic. It typically uses infrastructure monitoring as the primary Datadog service, based on the per-host pricing model, with limited additional monitoring. Costs remain relatively low and are easier to estimate, providing a baseline for more complex architectures. Additional services such as APM, synthetic monitoring, or other add-ons are often limited or absent, keeping the cost structure predictable. As a result, this is the most cost-controlled Datadog usage pattern, with relatively predictable increases.
Mid-Size Microservices Architecture
This scenario typically consists of multiple services, containers, or Kubernetes workloads with moderate traffic and increasing operational complexity. Datadog usage usually expands beyond infrastructure monitoring to include log management and APM. As a result, costs grow across multiple dimensions, driven not only by host count but also by log ingestion and trace volume as traffic increases. These additional services become the primary cost drivers, particularly as telemetry volume scales. Consequently, pricing becomes less predictable as services expand and container-based workloads scale dynamically.
These scaling patterns are especially relevant in Kubernetes observability environments where telemetry volume and time-series growth expand rapidly. For a broader architectural comparison, see Prometheus vs CloudWatch.
Enterprise-Scale Environment
This represents the most complex scenario, with large distributed systems comprising many hosts, high traffic, and multiple application domains. Extensive observability is required, typically involving infrastructure monitoring, logs, APM, custom metrics, and additional platform add-ons. With multiple pricing layers active, costs scale rapidly as increases in traffic, telemetry, and system complexity compound across services. Key cost drivers often include log volume, trace volume, and metric cardinality, many of which are not immediately visible. While Datadog delivers deep observability for enterprise systems, this level of visibility often comes with significantly higher cost.
Why Datadog Costs Can Scale Quickly
Datadog’s usage-based and modular pricing model can cause costs to rise quickly, as enterprise systems rapidly scale across hosts and traffic. Due to observability requirements, there are multiple pricing layers operating simultaneously that contribute to costs. Logs especially grow rapidly due to system activity and traffic that is typically high for enterprise systems. Also, many systems need customized metrics that are a significant cost driver due to the required tag combinations. Much-needed performance management and troubleshooting require sophisticated tools like APM, which significantly increases costs due to application traffic and service complexity. Therefore, additional Datadog layers mean that as activity increases, it will increase costs for each layer, contributing to the total cost. Hence, enterprise systems like banking or health will have observability costs that are difficult to predict and increase more rapidly than expected.
These observability scaling challenges also influence architectural decisions between AWS-native telemetry and pull-based monitoring systems such as Prometheus. See Prometheus vs CloudWatch.
Datadog vs CloudWatch Cost Comparison
Both Datadog and CloudWatch serve as observability platforms for AWS, but their pricing models differ in structure and complexity. Datadog’s pricing model is modular and is usage-based for monitoring, but applies multi-layer pricing for additional observability services. CloudWatch follows a simpler usage-based pricing model but is far more integrated with other AWS services since it is AWS-native. However, the trade-off is between feature richness and low cost. Datadog offers deeper observability but at a high cost, whereas CloudWatch is more cost-effective but less feature-rich. Enterprises where deep observability is essential favor Datadog with its high cost, but simple AWS-first environments favor CloudWatch’s low cost. For a detailed comparison of AWS-native monitoring versus enterprise observability platforms, see CloudWatch vs Datadog. Teams evaluating Kubernetes-native observability and pull-based telemetry models should also see Prometheus vs CloudWatch.
Is Datadog Worth the Cost?
It is the use cases and requirements that ultimately support the justification of Datadog’s cost, typically for enterprise systems with demanding performance criteria. These complex, distributed, and highly scalable systems invariably need the deep observability that Datadog provides, making it indispensable. These are usually business-critical systems, such as banking, that require the sophisticated troubleshooting tools Datadog provides, including logs, APM, and metrics. However, there are many simpler AWS-first environments that do not need the feature-rich observability that Datadog provides, and hence, its high cost cannot be justified. In these scenarios, CloudWatch monitoring is quite adequate with a lower cost and tighter AWS integration. Therefore, teams should evaluate architecture, scale, and observability needs before deciding whether to adopt Datadog or another platform that meets their needs at a lower cost.
If you want to build deeper expertise in monitoring and observability, structured learning platforms like Pluralsight offer courses on cloud monitoring, distributed systems, and performance analysis.
Explore observability and monitoring courses on Pluralsight.
To evaluate whether Datadog’s capabilities justify its cost compared to AWS-native monitoring, see CloudWatch vs Datadog.
Further Reading and Resources
Cloud Observability in Action – A practical guide to logs, metrics, and distributed system observability.
AWS Certified Security – Specialty Study Guide – Covers monitoring, logging, and security practices in AWS environments.
Site Reliability Engineering – A foundational resource for understanding large-scale system monitoring and reliability.
Affiliate Disclosure
This article may contain affiliate links. As an Amazon Associate and affiliate partner, I may earn a commission from qualifying purchases at no additional cost to you.
I only recommend resources that are relevant to cloud architecture, monitoring, and observability, and that I believe provide value based on practical experience.
